Astrato — four years inside a data platform
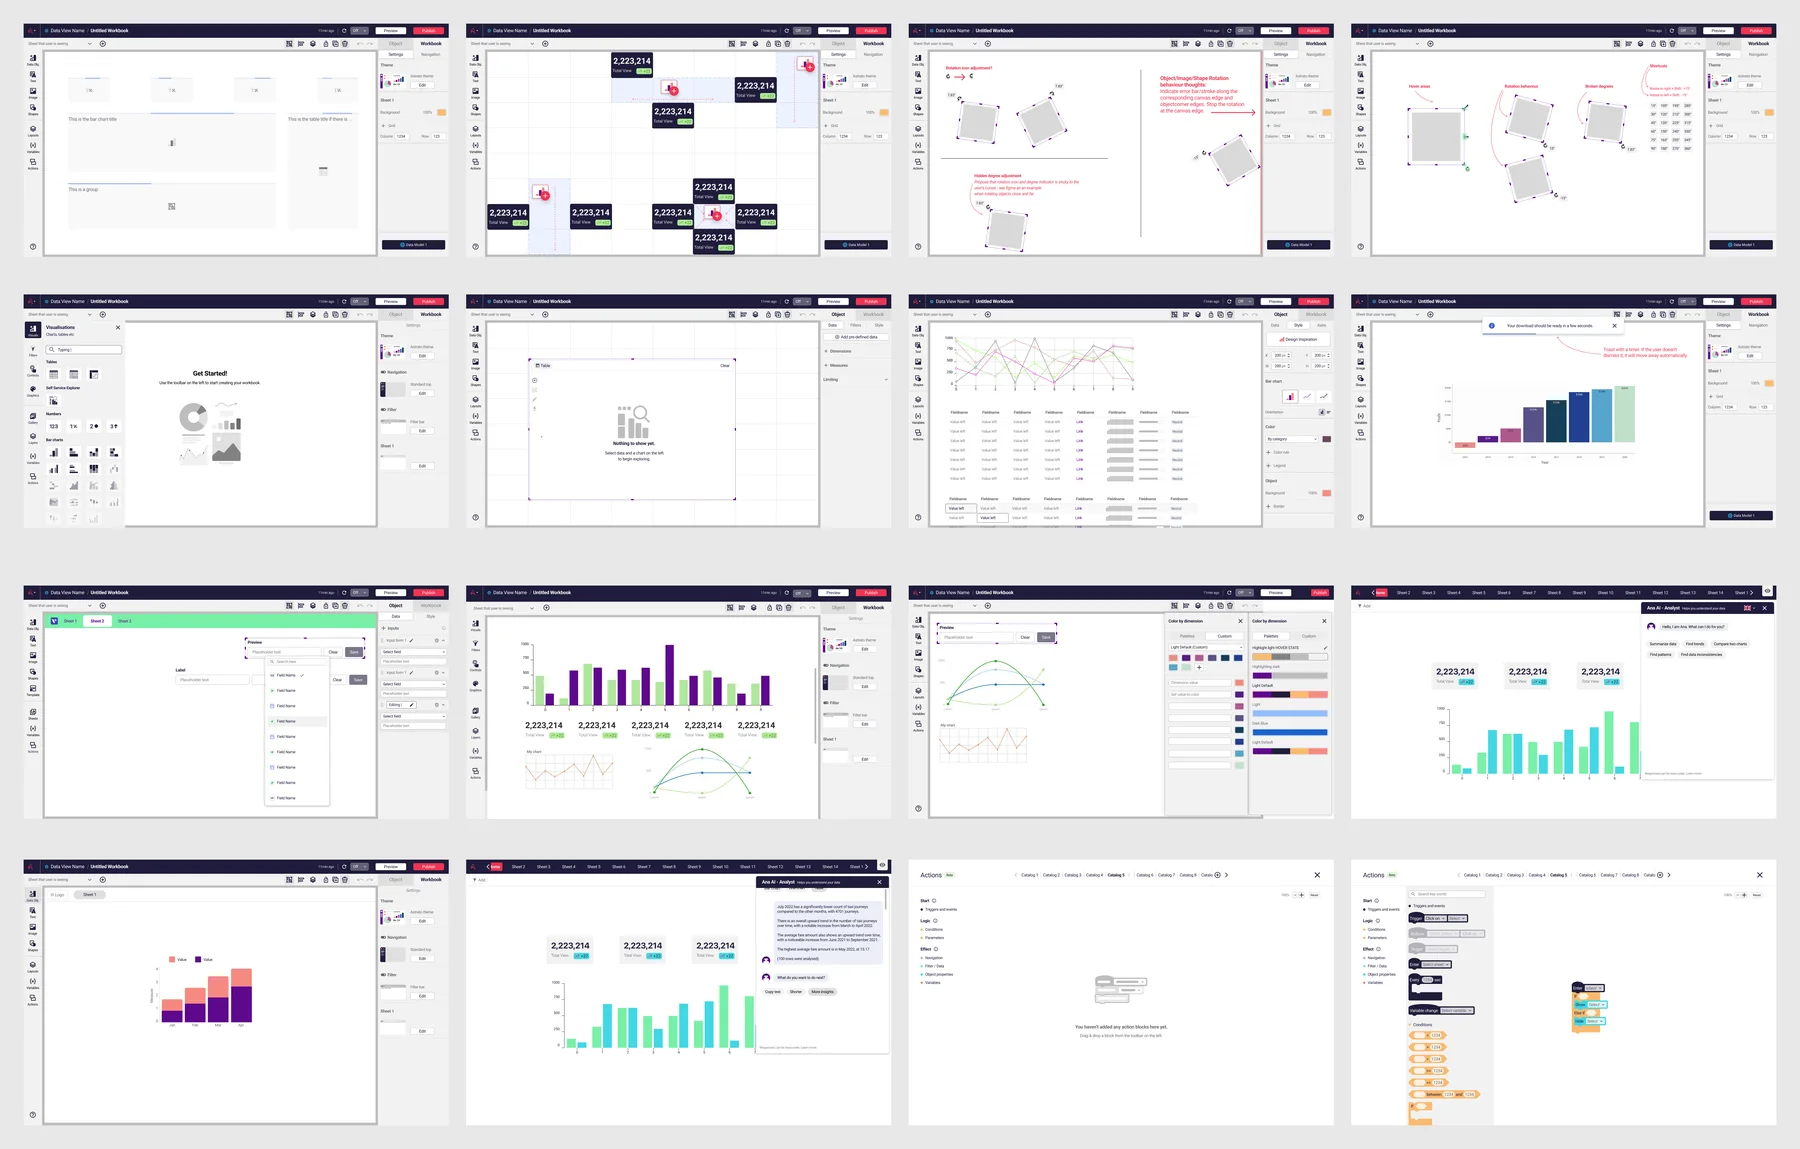
Astrato, by Vizlib, is a Snowflake-native analytics platform — insights and data visualisation for business decisions. I was the lead product designer across its two delivery pods for over four years: 40+ features, from the data-modelling canvas where analysts join their tables to an AI assistant that keeps its SQL in view.
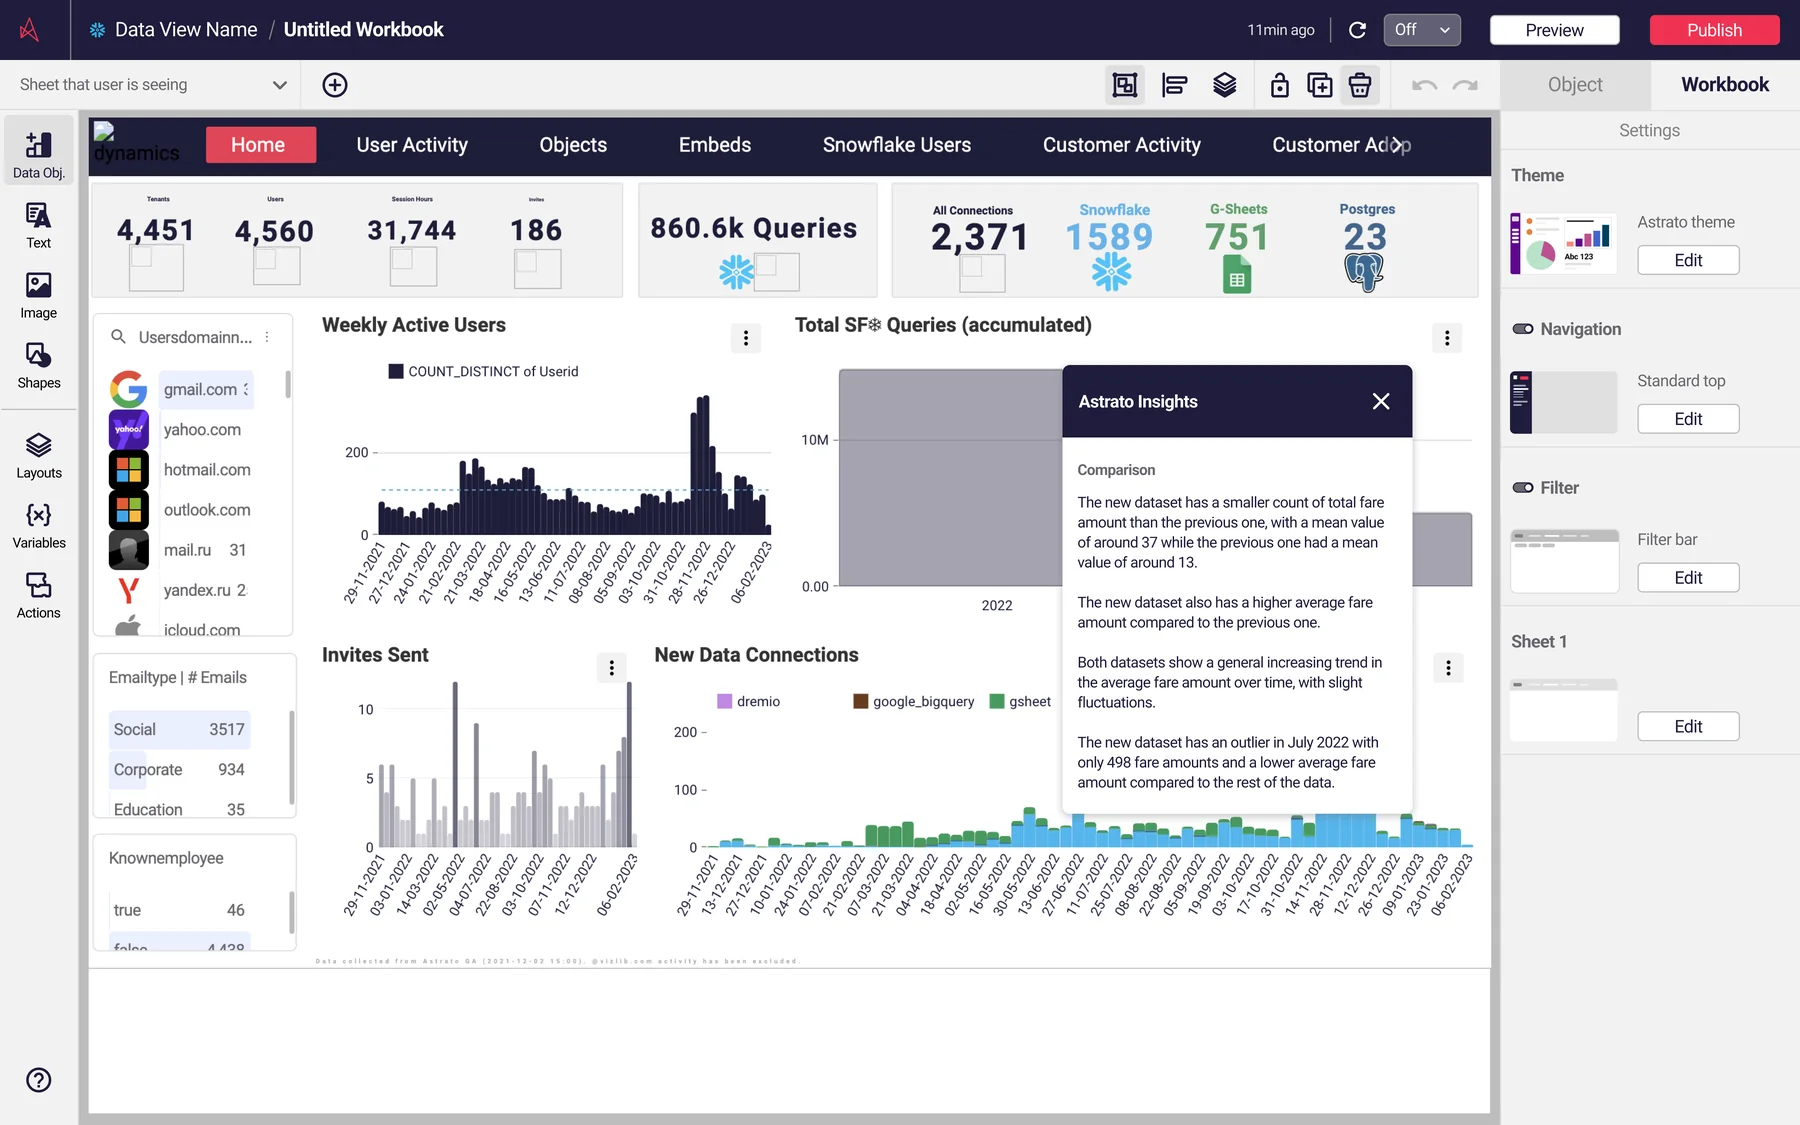
1,589 warehouses. 860.6k queries. One designer.
Astrato sits on the customer's own Snowflake warehouse and turns it into dashboards and answers — 1,589 Snowflake connections and 860.6k queries served on the GA telemetry screen alone. I designed across all of it for four years; what follows is the join canvas and the AI assistant, two threads from a list of 40+.
Two pods, 29 people, one designer between them
A decision made on the preparation side turns up on the visualisation side as a chart someone has to read. Being the only designer on both pods meant carrying that context across — four years of making two halves feel like one product.
Preptors
VIZ-Beans
The problem arrived as a ticket. The fix was geometry.
The canvas is where analysts join their tables before anything can be visualised — and by 2023 its problems were literally on file, in Jira.
"Messy overlapping join lines" JIRA VK-4532 · THE PROBLEM AS FILED
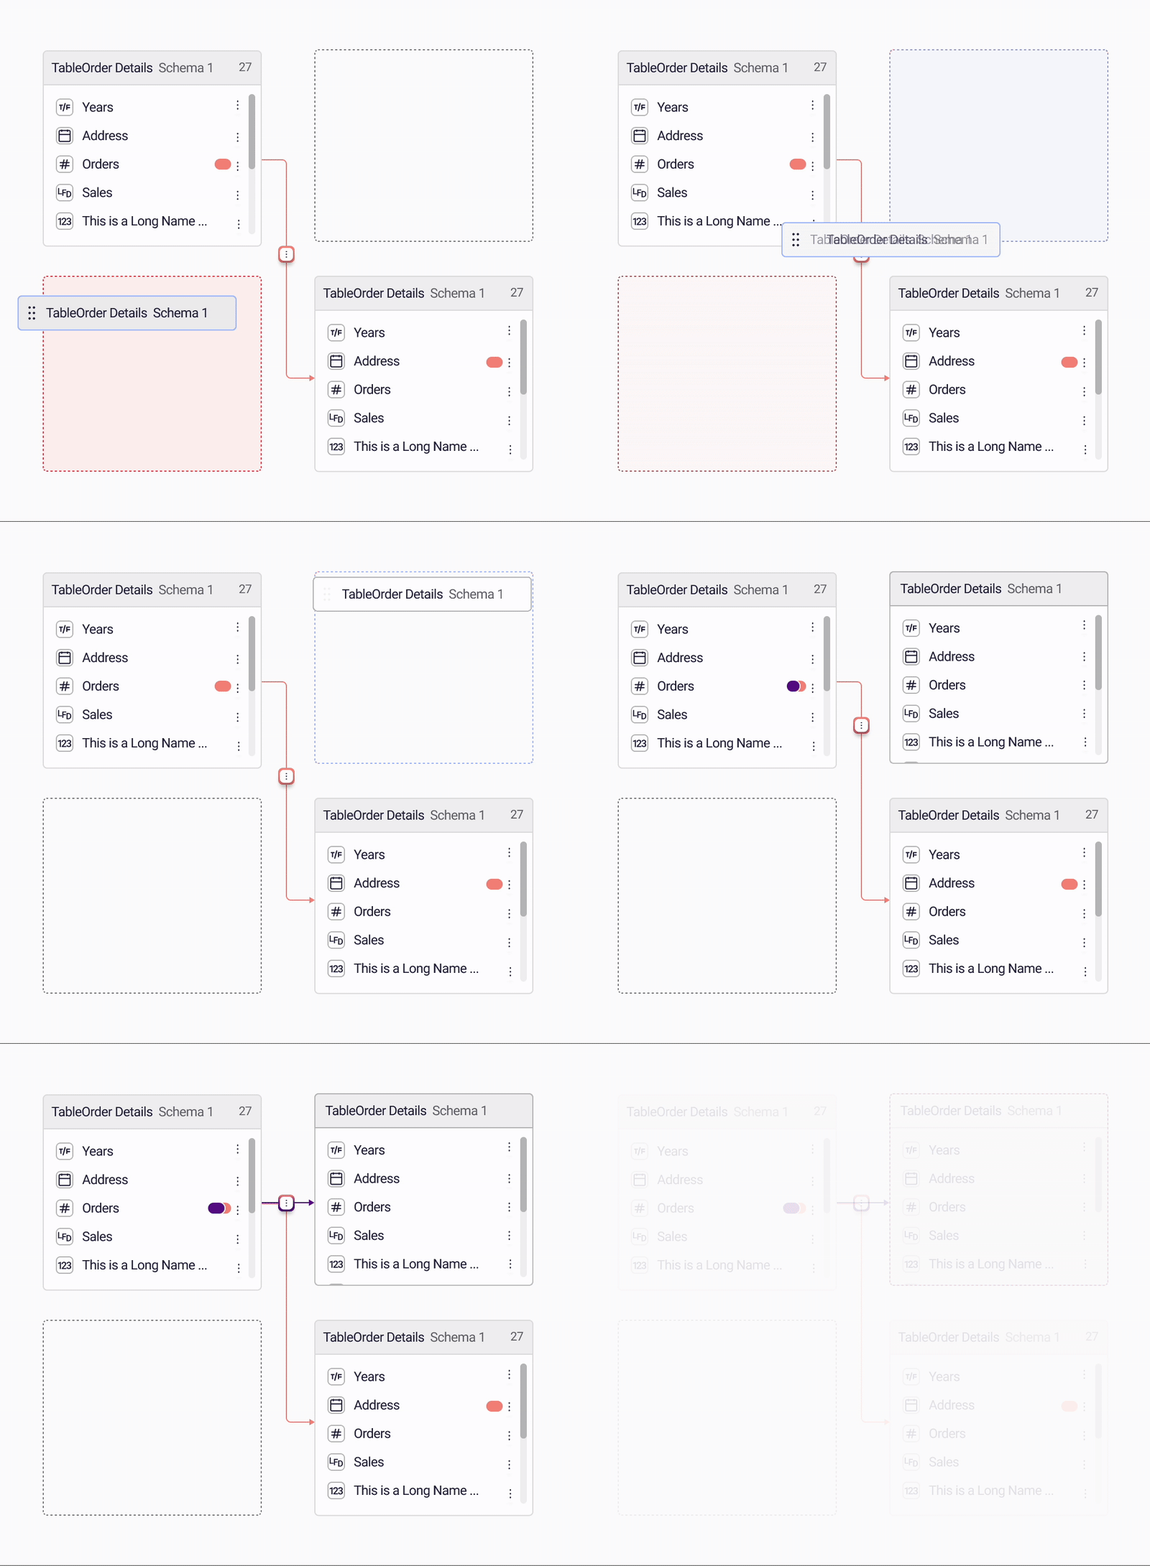
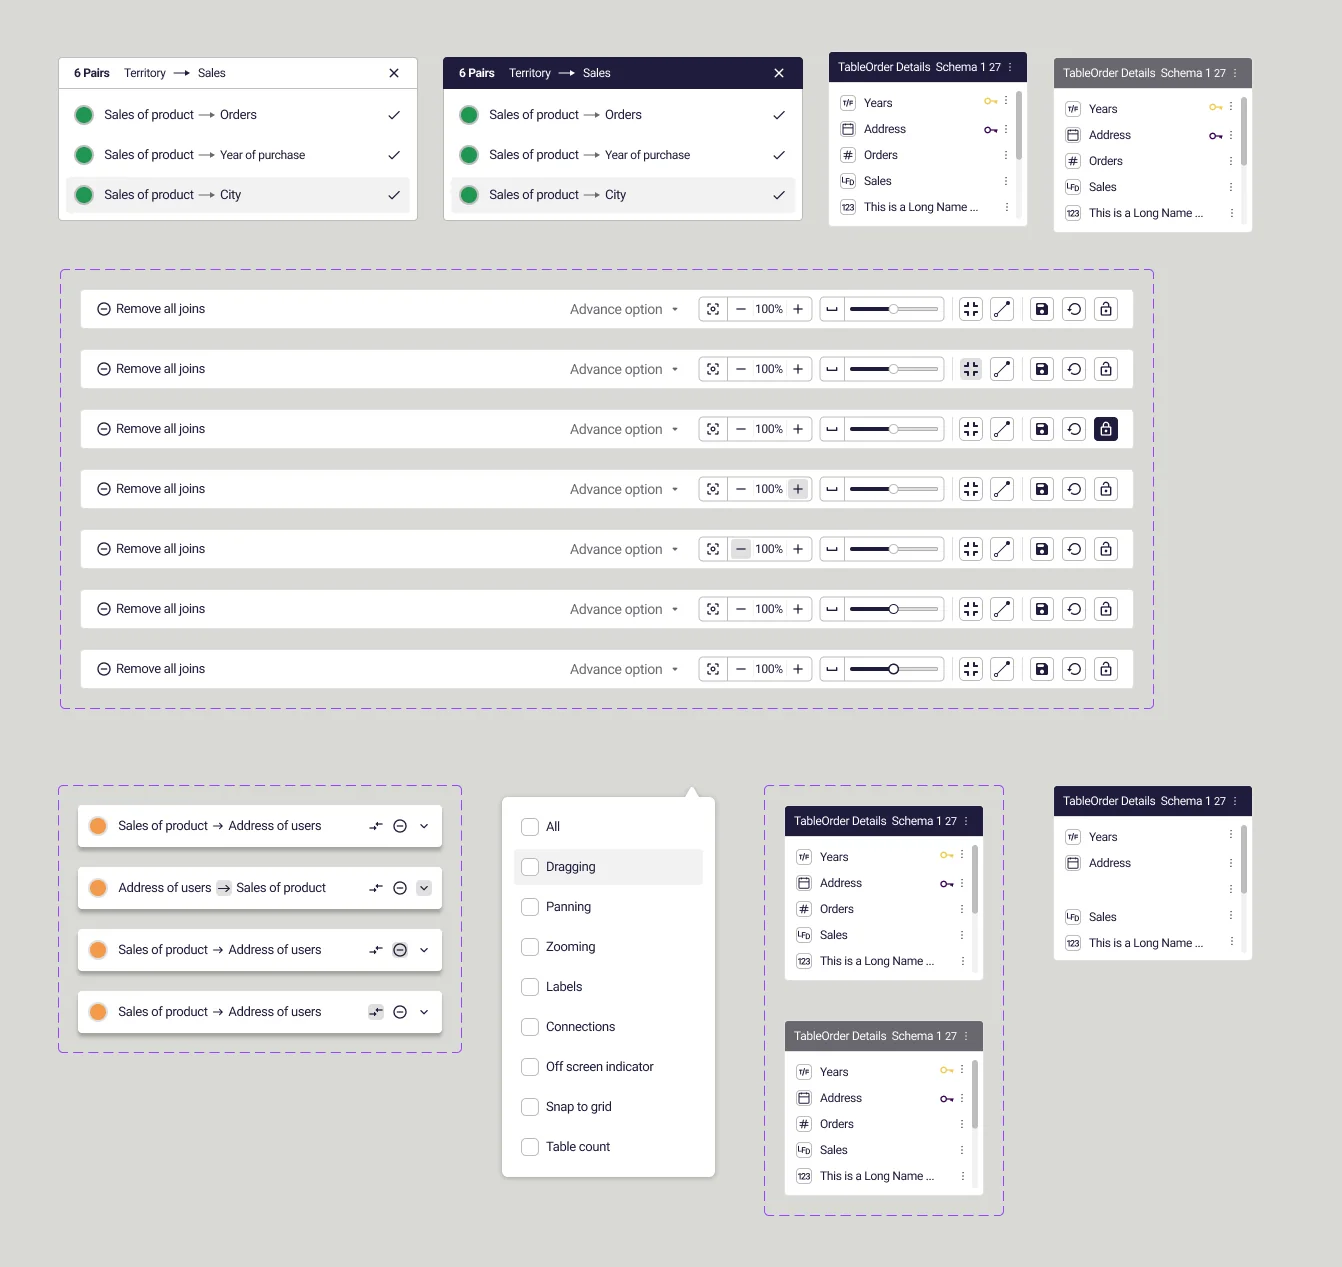
The redesign fixed the geometry first: joins route around tables, connect from any side, snap to a grid — and creating one takes 4 clicks. Flip the rebuild:
- Messy join lines, overlapping diagrams
- One-directional left-to-right line connections only
- No expand / collapse on tables
- No zoom on the canvas
- No indication that a table exists out of view
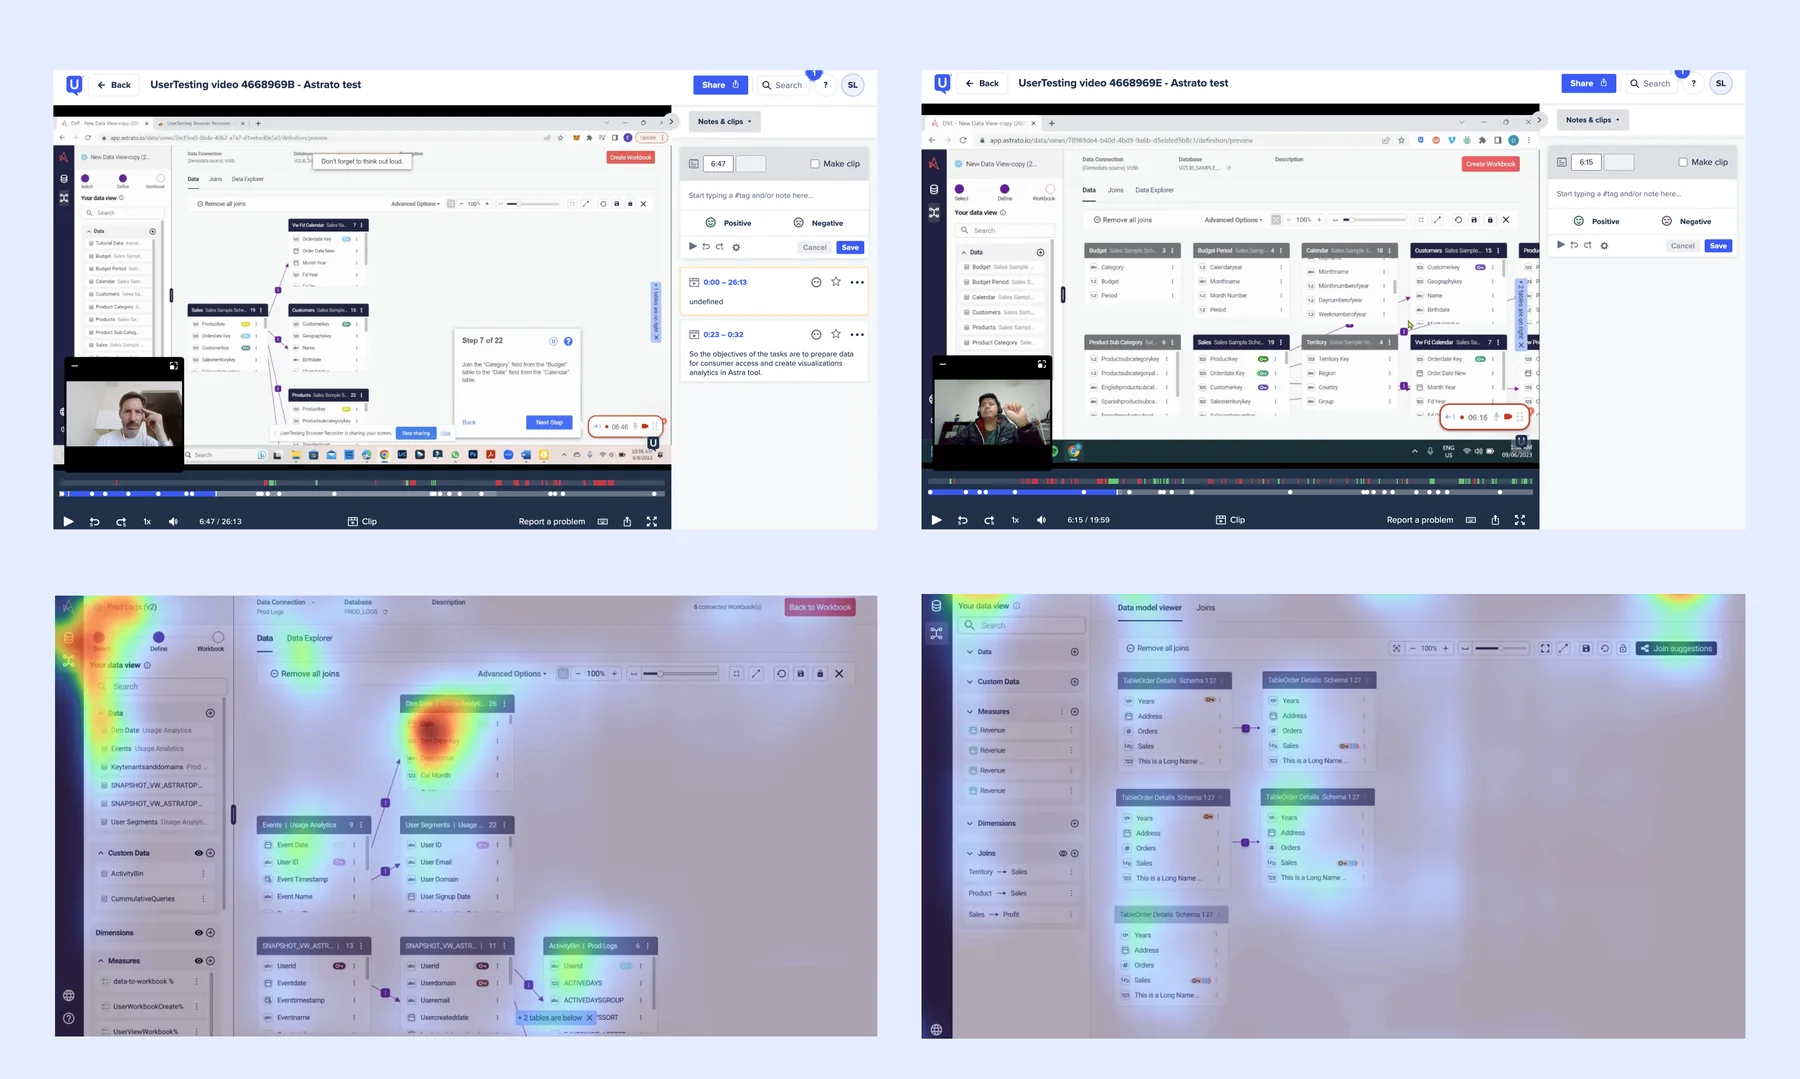
80% called it easy. I watched their eyes to be sure.
Think-aloud sessions on UserTesting.com, with attention heatmaps over the canvas — because where people actually look while building a join is not always where the interface assumes.
An AI assistant that shows its SQL
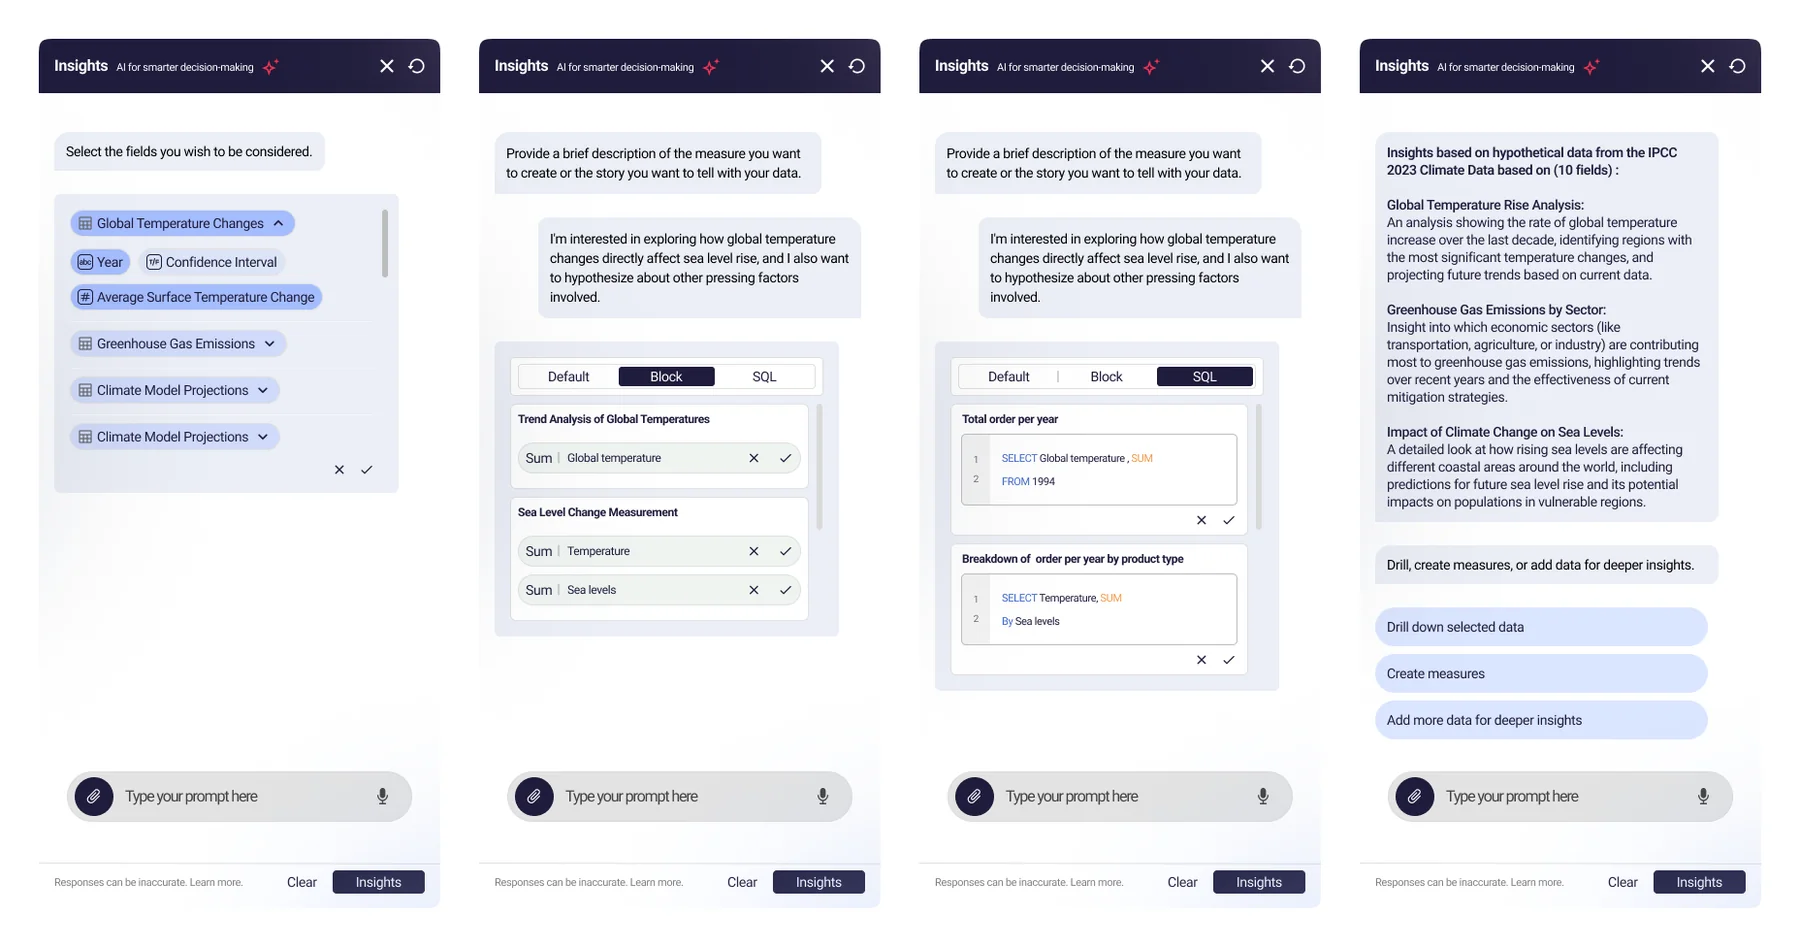
Pick the fields it may draw on — "based on 144 fields" — type a prompt, get measures, dimensions and SQL blocks back. The design position that mattered: the SQL stays visible and editable at every step. For people whose job is querying data, hiding the query would have broken trust.
Specs shipped as designed
Every new component is a maintenance cost someone pays later, so new ones appeared only when an existing one genuinely couldn't stretch. With eighteen engineers across the pods, precision in the spec was cheaper than conversations after the build.
Four years, one coherent product
Four years in one product teaches you something a portfolio of short engagements can't: features age. Dashboards get restyled, panels get renamed, and most of the 40+ things I shipped have been touched by someone else since. The work that compounded was structural — the join canvas fixed how the product thinks about connecting data, and it outlived every dashboard trend it shipped alongside.
Source notes
- Join canvas problems and affected users from Jira ticket VK-4532, last updated 3/8/2023, shown above.
- Research material from moderated UserTesting.com sessions — videos 4668969B (26 min) and 4668969E (20 min) — plus the six-session grid, heatmaps and results board, all from the project deck.
- Connection and query counts from product telemetry visible in the GA screenshot; data collected from Astrato GA, Dec 2021.
- Feature count, pod compositions, click count and the "based on 144 fields" panel are from the project deck.
- Full interactive case study: withcontexts.com/artifacts/astrato