Case file 004 · Novo Nordisk · on Astrato · reconstructed
Novo Nordisk, and the number that was true twice
Shad Abbaslou · Product Design Lead · Hands-on across AI, Agents and Workflows
18 min read · 9 min skimmed · 40 slides
A reconstruction. The engagement was real and delivered on Astrato; the company figures are public, the data in the product is fictional, and no outcome is claimed.

Case file 004 · Novo Nordisk · on Astrato · reconstructed
A reporting layer for a company whose sales both rose and fell in the same quarter, where the honest answer depends on a basis nobody was showing.
Outcome · up front
The honest version of a number is a slower one
Every figure in that band is public, taken from Novo Nordisk's own reporting, and none of them is a result of this work. I have not put an adoption number or a time-saved number on this page, because I cannot show you the measurement and a number you cannot check does not belong on a site whose argument is that every number carries its source.
How this is told
Two diamonds: the problem, then the answer
Each diamond opens wide and closes on one thing: the first on the problem worth solving, the second on the answer. It is the order this deck is told in, and every slide carries its phase at the top left; the case file keeps the order of the work.
- Two brands. One molecule. Two thirds…
- FIG. 004 · ONE MOLECULE, TWO THIRDS
- That concentration is the reason this…
- and 5 more
- The instinct in a room like that is to…
- So the rule the screens enforce is…
- Five systems that cannot change, drawn…
- and 2 more
The brief, in three lines
- Whata reporting layer for Novo Nordisk, built on Astrato
- Forfinance and supply planning
- Problemone quarter’s sales were up and down at once, depending on a basis no screen showed
THE PRODUCT, NOT A PICTURE
A walkthrough, 18 seconds, recorded from the rebuild. The cockpit, step by step: the basis switched and back, the bridge, the segments, and the same screen seen as one segment’s controller. Each step is captioned as it happens, and the transcript has the same words.
Phase 1 of 4 · widenDiscover
What was actually wrong, and for whom: the evidence before any answer.
The company
Two brands. One molecule. Two thirds of the company.
Novo Nordisk sells about DKK 309bn a year. Ozempic and Wegovy are DKK 206bn of that, roughly two thirds, and they are the same active molecule, semaglutide, in different presentations for different indications. One API, one supply chain, one patent estate, carrying most of a company that employs around 69,000 people and sells in about 170 countries.

The company
The company
That concentration is the reason this file exists. When one molecule carries two thirds of the revenue, the questions a finance team asks and the questions a supply team asks stop being different questions. "Can we make more" and "what will we book" are the same sentence read from two ends, and they were being answered in two different systems that did not agree.
The basis problem
Sales grew 32%. Sales fell 4%.
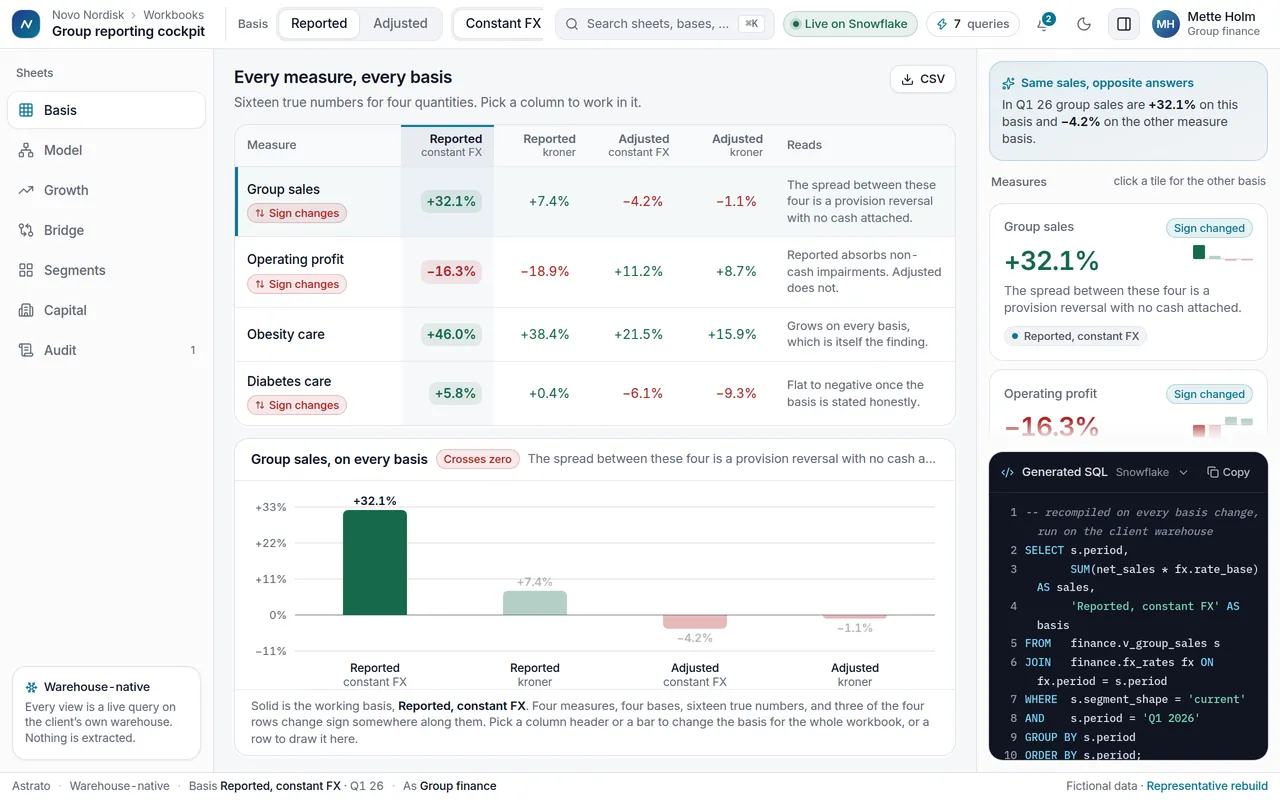
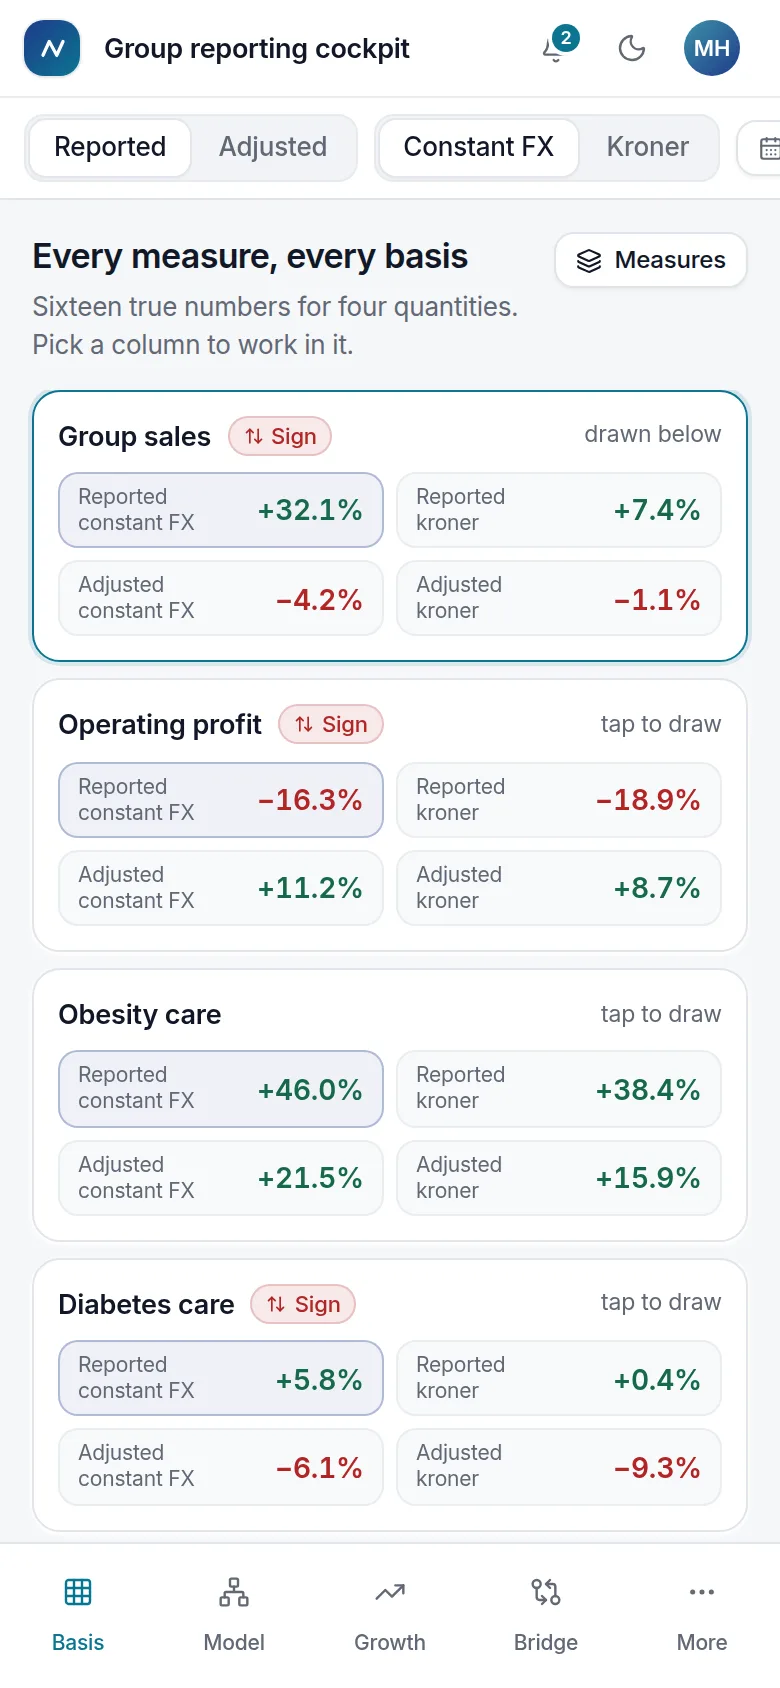
In the first quarter of 2026 Novo Nordisk reported sales up 32% at constant exchange rates and adjusted sales down 4% at constant exchange rates. Neither figure is wrong and neither is spin. They are the same sales measured on two bases, and the gap between them is a DKK 26.8bn provision reversal with no cash attached to it.
"Which number do I put in the deck?" THE QUESTION THE WHOLE PROJECT IS AN ANSWER TO
The basis problem
Research
The people who already knew which number was right
The analysts in finance and supply planning were not confused by the basis problem. They had solved it privately, each in their own spreadsheet, and the cost of that was not error so much as duplication and delay.

Research
What a reconstruction can honestly say about research is limited, and I would rather say the limited true thing than a detailed invented one. The pattern across this kind of engagement is consistent and it held here: the people closest to the data had already built the correct logic by hand, and they distrusted any central dashboard that could not show its working. The question they asked of every new screen was not "is this pretty" but "where did this come from, and on what basis".
Phase 2 of 4 · narrowDefine
The problem narrowed to the one worth solving, and the rules any answer had to keep.
The basis problem
The instinct in a room like that is to pick a default and move on. I argued against it, and the argument is the whole design. A default basis is a silent editorial decision taken by whoever built the dashboard, applied to everyone who reads it, and invisible at the moment it matters most. The company had introduced adjusted measures for 2026 precisely because the reported figures had stopped describing trading. Choosing one on a reader's behalf throws that away.
The basis problem
So the rule the screens enforce is narrow and absolute: no measure renders without the basis it was computed on. The basis is not a filter in a panel somewhere. It sits against the number, in the same visual breath, and it is the one control on the screen that restates everything at once.
The blueprint
Five systems that cannot change, drawn as one
The blueprint
Modelling across
You cannot fix the systems. You model across them.
Phase 3 of 4 · widenDevelop
The answer drawn, tried and argued over, including the parts that were thrown away.
The basis problem
The first version let you set basis per chart. It demoed well and it was wrong. Two tiles side by side on different bases is a chart that lies by adjacency. Basis went global, and the per-chart override became an explicit, labelled exception that marks the tile.

The basis problem
Nine seconds, recorded from the rebuild. The basis goes from reported to adjusted and group sales turn from +32.1% to −4.2%; to kroner, −1.1%; back to reported, +7.4%; and to constant FX, +32.1% again. Each time every figure, the chart and the generated SQL restate, and the cards whose sign changed say so.
Each chart, and what it has to say
Each chart, and what it has to say
A chart is chosen by the relationship it has to show, in the categories of the Financial Times’ Visual Vocabulary. In the rebuild every mark reads at 3:1 against its card or carries its value in print, so no number depends on telling two colours apart.
| Chart | What it has to show | The form, and why |
|---|---|---|
| One measure, every basis | Deviation: four readings of the same quantity either side of zero | Columns from a zero line, signed and coloured by direction; the basis in use solid, the other three quiet, every one with its value printed |
| Group sales growth | Change over time, across a change of definition | Quarterly columns with the segment change drawn as a seam, because a line would join two shapes that do not restate into each other |
| From one reading to the next | Flow: how one figure becomes another, step by step | A bridge, each step named and labelled, so the provision reversal is a bar with a name rather than a gap |
| Segments | Deviation, by segment | Horizontal bars from zero, labelled at their tips |
| Capital projects | Part-to-whole, at magnitude: spent within budget | Bars on one kroner scale, spent solid and what remains outlined; rings would show two schemes at 47% and 67% as comparable when one is three times the other |
Modelling across
The temptation is to quietly map the old segments onto the new ones and present an unbroken line. That line would be fiction. The model keeps both shapes and the charts draw the seam: before the restructure the series is drawn on the old basis and labelled as such, and the join is a visible discontinuity rather than a smoothed curve. A reader who wants a continuous trend has to ask for a restated one, and gets told what the restatement assumes.

The capital programme
A manufacturer spending a fifth of revenue on concrete
Novo Nordisk spent DKK 60.1bn on property, plant and equipment in 2025, roughly 19% of sales, on API capacity, aseptic production and packaging. At that scale the capital portfolio stops being a finance footnote and becomes an operating system of its own, with its own reporting needs.

The capital programme
The flow
From a validated record to a number someone signs
Research
The hardest conversation was not about charts. It was about whether a dashboard should be allowed to show a figure that a reader is not entitled to see the derivation of. I do not think it should. If the derivation is too sensitive to show, the figure is too sensitive to put on a shared screen.
Phase 4 of 4 · narrowDeliver
What the rebuild is held to, what each decision moved, and what I would do differently. No outcome is claimed.
What was broken · what changed · 01 of 05
The same quarter’s sales could be quoted as up 32% or down 4%, and both were correct, because reported and adjusted figures on two currency bases circulated without labels.
No measure renders without its basis. The control is global, sits against the figures rather than in a panel, and restates the whole screen in one act.
The company introduced adjusted measures because the reported ones had stopped describing trading. A dashboard that picks one basis silently throws that distinction away.
What was broken · what changed · 02 of 05
An early build let each chart carry its own basis, which produced screens where two adjacent tiles measured different things and looked like a comparison.
Basis went global. A per-chart override still exists, because sometimes you need one, but it visibly marks the tile as off-basis.
Adjacency is an argument. Two tiles side by side assert comparability whether or not the data supports it, and no caption undoes that.
What was broken · what changed · 03 of 05
The 1 January 2025 segment restructure meant history did not restate cleanly, and the easy fix was to map old segments onto new ones and draw one smooth line.
The model keeps both shapes and the chart draws the seam. A continuous trend has to be asked for, and arrives with its restatement assumptions stated.
A smoothed line across a definition change is the one chart nobody can audit later, because the discontinuity it hides is exactly what a reviewer would look for.
What was broken · what changed · 04 of 05
Capital projects were reported as percentage-complete rings, which made a DKK 49.6bn scheme and a DKK 15.9bn scheme look like comparable progress.
Budget and spend drawn to a common scale, with the operational date on the same row.
Percentage hides magnitude, and magnitude is what the decision turns on. Half of fifty billion and two thirds of sixteen are not the same news.
The spec
Five systems that cannot change, drawn as one
Outcome
The honest version of a number is a slower one
| It worked if | Result | Status |
|---|---|---|
| No figure appears without its basis | 0 figures on the cockpit without a basis stamp | Held in the rebuild |
| One act restates the whole screen | 1 basis change restates every tile, every chart and the generated SQL | Held in the rebuild |
| An override is never silent | 100% of off-basis tiles marked | Held in the rebuild |
| Readers adopt it and save time | Not measured, so not claimed | Not measured |
Outcome
What I would do differently
What I would tell another designer taking this on: the instinct to simplify is the enemy here. In a company reporting in one currency and earning in another, through a year with a provision reversal large enough to flip the sign of its own headline, the simplification is the error. The job is not to produce one number. It is to make the four honest ones legible, and to make it impossible to quote one without saying which.
- Agree the measurement before it ships. This page carries no adoption or time-saved number because I cannot show the measurement. A reporting layer about honest numbers should have shipped with its own.
- Put the click in front of readers early. Surfacing the basis costs every reader a click and a moment of thought. I would have tested that trade with finance and supply planning in the first prototype, not argued it afterwards.
THE PRODUCT, NOT A PICTURE
The finished product, running
Case file 004 · Novo Nordisk · on Astrato · reconstructed
Questions
The honest version of a number is a slower one
A reconstruction. The engagement was real and delivered on Astrato; the company figures are public, the data in the product is fictional, and no outcome is claimed.
The other decks001 · OI·DS002 · Astrato003 · Safe Space005 · JBS