← 002

Astrato, three years inside a data platform 48 slides · The problem, The decision, The work, What shipped

01 / 48

Case file 002 · Astrato, by Vizlib · three years · two pods

Astrato, three years inside a data platform

Shad Abbaslou · Product Design Lead · Hands-on across AI, Agents and Workflows

20 min read · 14 min skimmed · 48 slides

The Astrato workbook builder on a desk: a usage dashboard of KPIs and charts, with the sheets and settings panel open on the right
The rebuilt Astrato workbook on its Home sheet, fictional data: tenants, users, session hours, weekly active users and the queries chart, the settings panel open at the right

Rebuilt & running · fictional data

Astrato · the workbook builder

Filter the dashboard, select an object and restyle it, ask Ana about what you are looking at.

The brief, in three lines

  • Whatthe workbook builder, join canvas and AI assistant of a Snowflake-native analytics platform
  • Fordata teams turning their own warehouse into models and dashboards
  • Problemthe canvas where every model begins had been filed as a bug

The teams

Two pods, 29 people, one designer between them

A decision made on the preparation side turns up on the visualisation side as a chart someone has to read. Being the only designer on both pods meant carrying that context across: three years of making two halves feel like one product.

PreptorsData preparation9Head of Product · Head of Engineering · 6 front-end devsVIZ-BeansData visualisation201 PM · 12 front-end engineers · 2 data scientists · 4 QAme · the designer

THE PRODUCT, NOT A PICTURE

A walkthrough, 28 seconds, recorded from the rebuild. The workbook, step by step: a filter, the data model, Insights answering with its SQL, the answer kept, the event log and the preview. Each step is captioned as it happens, and the transcript has the same words.

Phase 1 of 4 · widenThe problem

What was wrong, who it was hurting, and how we found out.

The problem arrived as a ticket…"Messy overlapping join lines"Four of five called it easy. I…The research programme, and where…watching where the canvas…Think-aloud sessions on…sessions 4668969B and 4668969E, 26…Attention gathered on the data…where people actually looked while…4 of 5 participants rated it 4 / 5…The task, the question and the…
The join canvas as it was found: join lines in red crossing tables they do not connect to, every connection forced left to right

The join canvas

VK-4532 · Join canvas · usability problems

The problem arrived as a ticket. The fix was geometry.

  • Messy join lines, overlapping diagrams
  • One-directional left-to-right line connections only
  • No expand / collapse on tables
  • No zoom on the canvas
  • No indication that a table exists out of view
"Messy overlapping join lines" JIRA VK-4532 · THE PROBLEM AS FILED
Six UserTesting sessions with analysts, each recording showing the join canvas on screen; the participants are blurred

Research · 6 moderated sessions

Four of five called it easy. I watched their eyes to be sure.

Think-aloud sessions on UserTesting.com, with attention heatmaps over the canvas, because where people actually look while building a join is not always where the interface assumes.

Research · 6 moderated sessions

The research programme, and where it landed.

Sessions6moderated, on UserTesting.com
ProtocolThink-aloudwatching where the canvas surprised people
Recordings2 in the decksessions 4668969B and 4668969E, 26 and 20 minutes
HeatmapsAttentionwhere people actually looked while building a join
Four of the six UserTesting sessions, each recording showing the join canvas on screen; the participants are blurred

Research · 6 moderated sessions

Protocol · Think-aloud

watching where the canvas surprised people

A UserTesting session recording on the join canvas, with the moderator notes panel open beside it; the participant is blurred

Research · 6 moderated sessions

Recordings · 2 in the deck

Think-aloud sessions on UserTesting.com, with attention heatmaps over the canvas, because where people actually look while building a join is not always where the interface assumes.

A second UserTesting session recording on the join canvas; the participant is blurred

Research · 6 moderated sessions

Recordings

sessions 4668969B and 4668969E, 26 and 20 minutes

An attention heatmap over the join canvas: attention gathers on the data list at the left

Research · 6 moderated sessions

Heatmaps · Attention

Attention gathered on the data list at the left and on each table’s header; the join lines, the thing the canvas exists to show, drew far less. So the rebuilt canvas names each table’s joins under its header, where people were already looking.

An attention heatmap over the join canvas: attention gathers on the table headers, far less on the join lines

Research · 6 moderated sessions

Heatmaps · Attention

where people actually looked while building a join

Task difficulty after the redesign

4 of 5 participants rated it 4 / 5 towards "very easy"

4 of 5 answered 4, one answered 3, nobody answered 5 95% interval for 4 of 5: 36% to 98% A strong signal and a weak statistic, which is why the page never turns it into a percentage

Research · 6 moderated sessions

The task, the question and the heatmaps, and what they found

The task, as a session note records its objective: “prepare data for consumer access and create visualisations”With

5 participants

What it found

Set on the redesigned canvas, the one the product runs, where a join takes four clicks; one task and one question were the whole evidence base

How difficult was it, from 1, very difficult, to 5, very easy?With

5 participants

What it found

4 of 5 answered 4, one answered 3, nobody answered 5 95% interval for 4 of 5: 36% to 98% A strong signal and a weak statistic, which is why the page never turns it into a percentage

Where people looked while building a join, from the attention heatmapsWith

The moderated sessions

What it found

On the data list and the table headers, much less on the lines; each table now names its joins under its header, and hovering one lights its line

Phase 2 of 4 · narrowThe decision

The one thing worth fixing, and the rules we set ourselves.

An analyst who cannot read a model…The whole model lives or dies at…FIG. 002 · THE KPI TREEFIG. 005 · WHAT A TANGLE COSTSAn assistant that answers a data…Showing the working, assistant by…

The join canvas

An analyst who cannot read a model does not file a bug about it; they quietly build a second one. That is what the join canvas was costing, and it is why the redesign started with geometry rather than styling.

The flow · end to end

The whole model lives or dies at one decision: can an analyst read the joins they just made.

The blueprint

WHAT THE JOIN WORK WAS MEASURED ON, AND THE TWO USAGE FIGURES THE PRODUCT REPORTS ABOUT ITSELF A MODEL PEOPLE CAN READ 4 clicks to create a join after the canvas was rebuilt, down from a maze that forced every connection left to right JOIN CANVAS · VK-4532 4 of 5 RATED THE JOIN TASK EASY participants, each 4 out of 5 towards very easy, after the redesign USERTESTING · 6 MODERATED SESSIONS 6 MODERATED SESSIONS think-aloud, with attention heatmaps over the canvas; two of them in the deck at 26 and 20 minutes SESSIONS 4668969B AND 4668969E 1,589 SNOWFLAKE CONNECTIONS off the product’s own usage screen, the one the workbook on this page is built from GA TELEMETRY SCREEN 860.6k QUERIES SERVED on the telemetry screen alone; the queries tile on the Home sheet reads the same figure GA TELEMETRY SCREEN THE RESULTS SLIDE CARRIES MORE NUMBERS; THE ONES WITHOUT A STATED DERIVATION ARE LEFT OFF THIS PAGE
Two of the four are research measures and two are the product reporting on itself. The outcome section says which numbers from the results slide were dropped for having no derivation.MEASURED, THEN KEPT OR DROPPED

The join canvas

A DRAWING PROBLEM, FOLLOWED TO WHERE IT IS PAID FOR 01 A MODEL NOBODY CAN READ join lines cross tables they have nothing to do with 02 SO IT IS NOT TRUSTED a model you cannot follow is a model you cannot check 03 SO THE TEAM BUILDS ITS OWN faster than arguing about somebody else’s 04 REDUNDANT DATA VIEWS the same question modelled several times over 05 AND EVERY VIEW IS QUERIED against a warehouse billed by the second THE BUSINESS CASE WAS NEVER THE CANVAS. IT WAS WHAT THE CANVAS COST WHEN IT DID NOT WORK. THE FIX WAS THE GEOMETRY, NOT A BIGGER WAREHOUSE FOUR CLICKS TO A JOIN · 4 OF 5 RATED IT EASY
An analyst who cannot read a model does not file a bug about it; they quietly build a second one. That is what the join canvas was costing, and it is why the redesign started with geometry rather than styling.UNREADABLE MODEL → DUPLICATE VIEWS → QUERY SPEND

Astrato Insights

An assistant that answers a data question with a chart asks people whose whole job is querying data to trust a black box.

Pick the fields it may draw on ("based on 144 fields"), type a prompt, get measures, dimensions and SQL blocks back. The design position that mattered: the SQL stays visible and editable at every step. For people whose job is querying data, hiding the query would have broken trust.

How others show their working

Every assistant that writes queries for analysts has to decide how much of the query to show. What each of these shows, from its own documentation.

Showing the working, assistant by assistant

Snowflake Cortex AnalystWhat it shows

The SQL it generated for the question

What the analyst can do with it

Edit it, rerun it, and save the pair to a repository of verified queries the assistant draws on next time

ThoughtSpot SageWhat it shows

The search tokens the question became: the measures, attributes and filters

What the analyst can do with it

Edit the tokens; the documentation asks users to check them before sharing an answer

Power BI Copilot, in DAX query viewWhat it shows

A DAX query, with comments

What the analyst can do with it

Run it, keep or discard it, and ask for it to be explained step by step

Astrato InsightsWhat it shows

The fields in scope, then the answer, its blocks and its SQL, as three views of one thing

What the analyst can do with it

Change the scope, edit the SQL at any step, and add the answer to the sheet as an object they own

Phase 3 of 4 · widenThe work

What we drew, tried, threw away and kept.

Before · VK-4532 / After · shippedThe join canvasNo join label is covered by a…An AI assistant that shows its SQLFIG. 006 · INSIGHTS, THE QUERY…Seven seconds, recorded from the…Insights and Ana read only what…The SQL is not a disclosure panel…Every assistant that writes…Specs shipped as designedSixteen screens of the workbook…Every dashboard in the product…Publishing snapshots the workbook…

The join canvas

The redesign fixed the geometry first: joins route around tables, connect from any side, snap to a grid, and creating one takes 4 clicks.

The join canvas as it was found: join lines in red crossing tables they do not connect to, every connection forced left to rightThe joins editor: four tables with three joins routed around them, the join type and the generated SQL beside the canvasBefore · VK-4532After · shipped
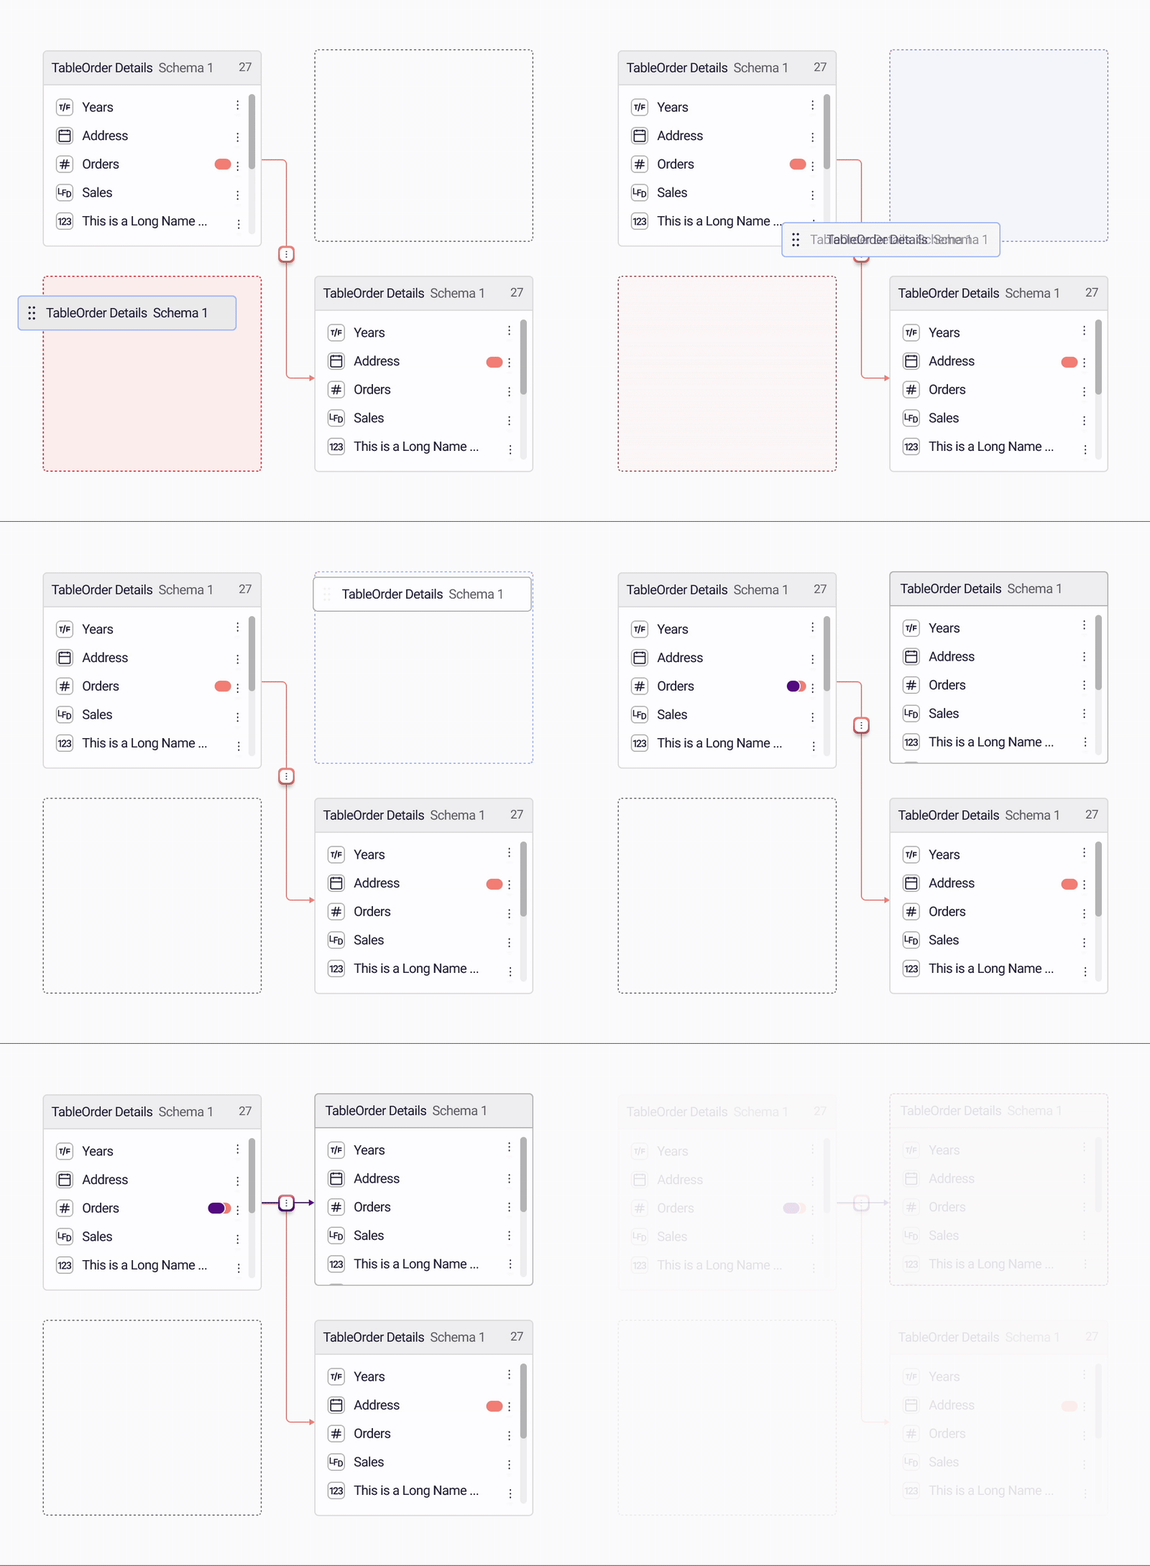
The join canvas

Screen recording of the redesigned join canvas: joins routing around tables and snapping to the grid
The real canvas in motion: a screen recording of the shipped product.RECORDING · MAR 2025
The rebuilt join canvas: four tables on a grid, every join routed around the tables it does not connect, no label covered

Rebuilt & running · fictional data

AS-06

No join label is covered by a table or crossed by another join.

The Astrato Insights panel in three frames: the typed question, the measures and dimensions it resolved into fields, and the SQL blocks

Astrato Insights

An AI assistant that shows its SQL

Pick the fields it may draw on ("based on 144 fields"), type a prompt, get measures, dimensions and SQL blocks back. The design position that mattered: the SQL stays visible and editable at every step. For people whose job is querying data, hiding the query would have broken trust.

Astrato Insights

01 SCOPE THE FIELDS 144 fields the analyst chose, and the ask is bounded to them 02 THE PROMPT 1 plain-language question, no query language required 03 THE SUGGESTION 3 parts returned: measures, dimensions and the SQL 04 THREE VIEWS 3 the answer, its parts, and the SQL, all editable 05 INTO THE SHEET 1 object on the canvas. The query stays yours
The SQL is not a disclosure panel opened after the fact; it is present at every step, and editable.INSIGHTS · THE QUERY STAYS VISIBLE

Astrato Insights

Seven seconds, recorded from the rebuild. Insights is opened and asked for MRR by region. It answers in its default view, four regions ranked, then shows the SQL that produced the answer, open to edit, with Add to sheet beneath it.

The rebuilt Insights panel answering a question about MRR by region: the fields in scope, the ranked regions and the answer kept to the sheet

Rebuilt & running · fictional data

AS-04

Insights and Ana read only what the sheet shows.

The rebuilt Insights panel with its SQL view open: the query that produced the answer, editable

Rebuilt & running · fictional data

The SQL is not a disclosure panel opened after the fact; it is present at every step, and editable.

Four Insights panels showing how the scope of a question is refined, with the tables to include or exclude and a plain-language explanation of the result

Astrato Insights

Every assistant that writes queries for analysts has to decide how much of the query to show. What each of these shows, from its own documentation.

A component spec sheet with measurements and states, as delivered to engineering

System & handoff

Specs shipped as designed

Every new component is a maintenance cost someone pays later, so new ones appeared only when an existing one genuinely couldn't stretch. With eighteen engineers across the pods, precision in the spec was cheaper than conversations after the build.

Sixteen screens of the Astrato workbook editor arranged in a grid

System & handoff

Sixteen screens of the workbook editor, one system underneath.

The rebuilt workbook on its data model: the tables of the model listed with their fields and types

Rebuilt & running · fictional data

Every dashboard in the product starts in the join canvas

The model is the load-bearing layer: every sheet, every answer and both exits sit on it.

The rebuilt workbook with its version history open: every published snapshot listed, any of them restorable

Rebuilt & running · fictional data

AS-05

Publishing snapshots the workbook, and any version can be restored.

Phase 4 of 4 · narrowWhat shipped

What went out, what it changed, and what I would do again.

Join lines crossed tables they had…The canvas complaints were…An assistant that answers a data…Three years, one coherent productThree years, one coherent productWhat I would do differentlyThree years, one coherent product

What was broken · what changed · 01 of 06

Was broken

Join lines crossed tables they had nothing to do with, every connection was forced left to right, and reading a model meant untangling it first. It was on file as VK-4532, affecting BI developers and data analysts.

What I changed

Rebuilt the canvas geometry rather than restyling it: joins route around tables, connect from any side, and snap to a grid, and creating one takes four clicks.

What it moved

4 of 5participants rated the join task 4 out of 5 towards “very easy” after the redesign.USERTESTING, 6 MODERATED SESSIONS

What was broken · what changed · 02 of 06

Was broken

The canvas complaints were opinion, argued release after release, so nothing was prioritised.

What I changed

Ran think-aloud sessions on UserTesting.com with attention heatmaps over the canvas, so what people looked at while building a join became evidence rather than a claim.

What it moved

6moderated sessions, two of them in the deck at 26 and 20 minutes. The clutter stopped being an opinion and became measurable.SESSIONS 4668969B & 4668969E

What was broken · what changed · 03 of 06

Was broken

An assistant that answers a data question with a chart asks people whose whole job is querying data to trust a black box.

What I changed

Kept the SQL visible and editable at every step (Default, Block and SQL views of the same suggestion), and made the field scope explicit up front: “based on 144 fields”.

What it moved

Insights shipped as something its users can check: nothing is returned that cannot be opened, read and rewritten by the analyst it was generated for.ASTRATO INSIGHTS, AS SHIPPED

Outcome

Three years, one coherent product

A join takes a handful of clicksResult

4 clicks, down from a maze that forced every connection left to right

Met
Analysts find the modelling task easyResult

4 of 5 participants rated it easy, across 6 moderated sessions; a strong signal from a small sample

Met
The assistant’s answers can be checkedResult

The SQL stays visible and editable at every step of Insights

Met
The bill for duplicated dashboards fallsResult

Not measured; the hindsight below says what I would change, and the plan after it how

Not measured

Outcome

Three years, one coherent product

29people across two pods9 PREPTORS · 20 VIZ-BEANS · ONE DESIGNER ON BOTH
1,589Snowflake connectionsOFF THE PRODUCT'S OWN USAGE SCREEN
4clicks to create a joinDOWN FROM A MAZE
4 of 5participants rated the join task easyON TAPE · USERTESTING

Outcome

What I would do differently

  1. Spend more of the years on what does not age. Most of what I shipped in three years has been touched by someone else since; the work that compounded was structural. I would have moved to the model and the canvas sooner.
  2. Measure the bill, not only the task. The case for the canvas was the duplicated dashboards and the query bill they ran up, and the research measured how easy the task was. I would instrument the bill from the first sprint.
  3. Run more than five sessions before quoting a percentage. Four of five participants rating the task easy is a strong signal and a weak statistic.
The rebuilt Astrato workbook on its Home sheet, fictional data: tenants, users, session hours, weekly active users and the queries chart, the settings panel open at the right

Rebuilt & running · fictional data

AS-02

Three years, one coherent product

A filter applies to every object on the sheet and says how much of the data is left.

THE PRODUCT, NOT A PICTURE

The finished product, running
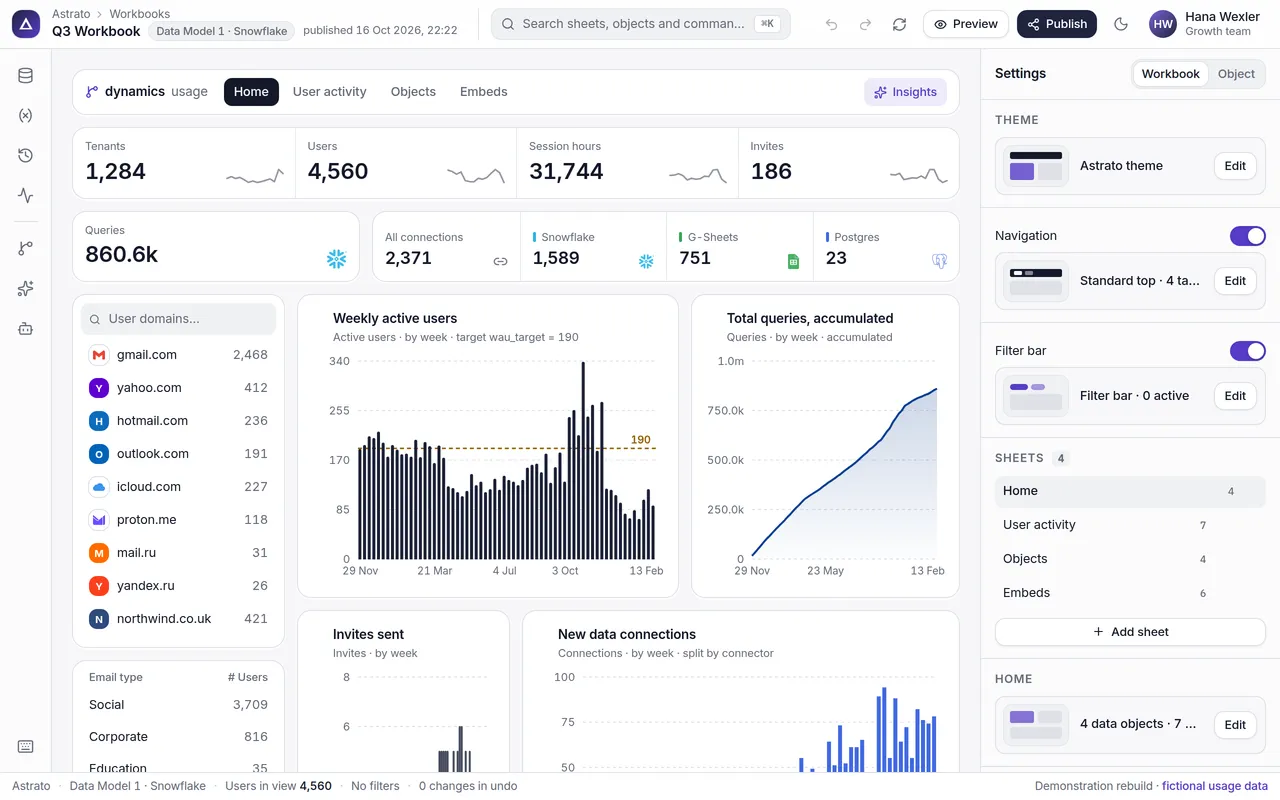
Filter the dashboard, select an object and restyle it, ask Ana about what you are looking at.

Open it full screen ↗
The Astrato workbook builder on a desk: a usage dashboard of KPIs and charts, with the sheets and settings panel open on the right

Case file 002 · Astrato, by Vizlib · three years · two pods

Questions

Three years, one coherent product

The other decks001 · OI·DS003 · Safe Space004 · Novo Nordisk005 · JBS

Notes