Forty features. One product.
Forty features across two pods is a throughput number, and throughput is the least interesting thing about three years. The job was making them behave like one product. This is the deck, with the ticket behind the largest of them left in.
Joins routed around tables not dragged through them. Drag one.
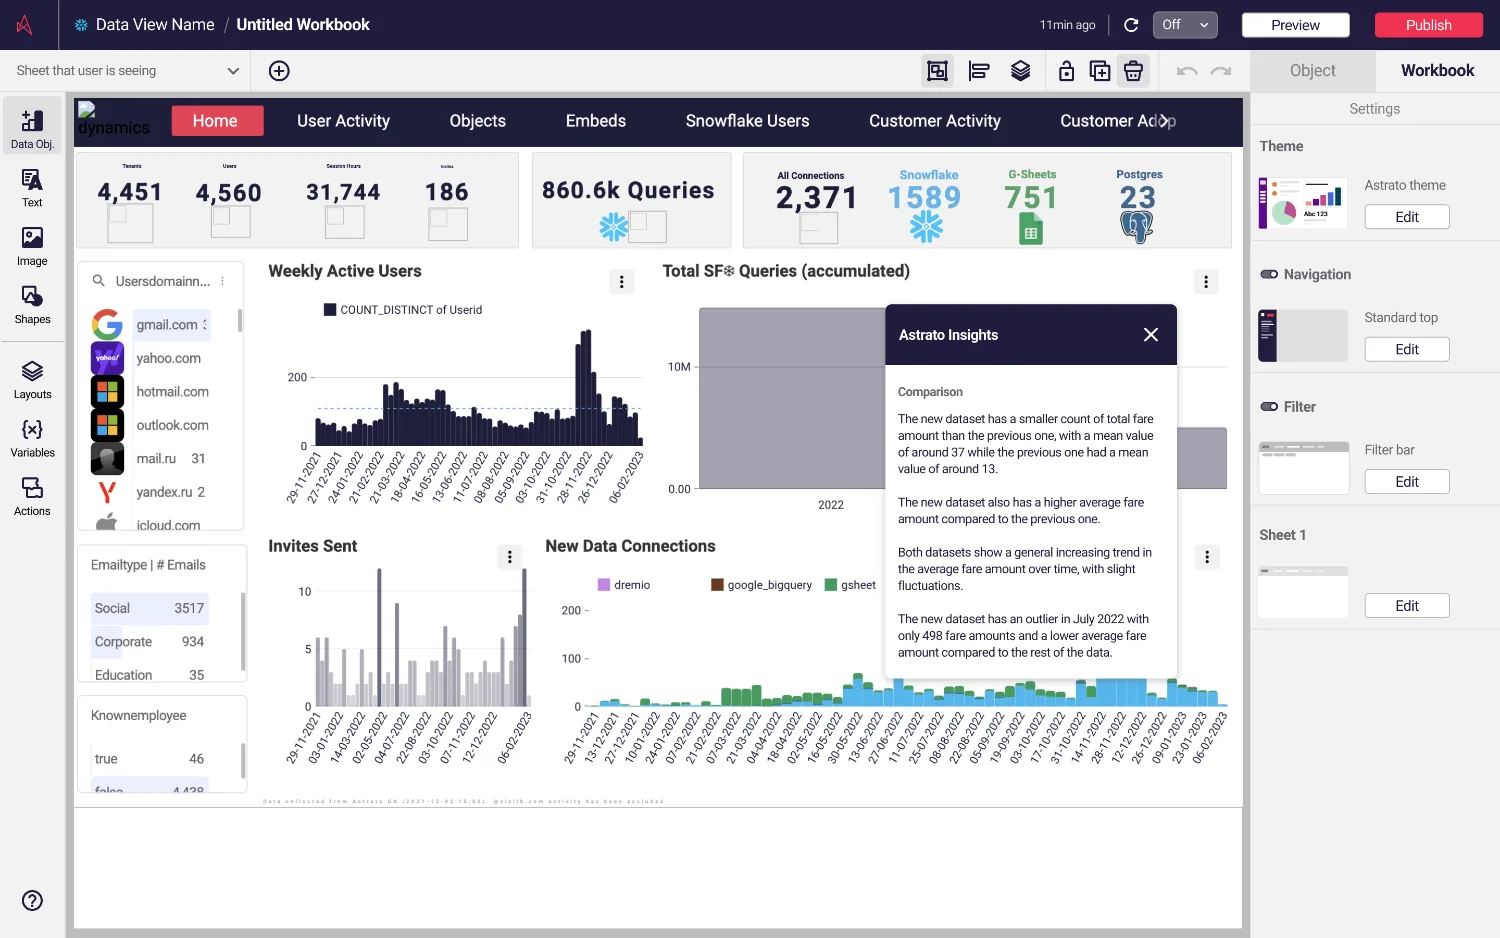
1,589 Snowflake connections, 860.6k queries
Astrato runs on the customer's own Snowflake warehouse and turns it into dashboards and answers. The numbers are off the product's own usage screen, which is the right place to establish what a design decision here is standing on: not a prototype, a platform with live data in it.
Two pods, 29 people, one designer counted twice
Preparation and visualisation were separate teams with separate roadmaps and no shared ceremony. A decision taken on one side arrived on the other as a chart somebody had to read, weeks later, with nobody accountable for the join between them except the person who sat in both stand-ups.
Read this plate as text
Twenty-nine people in two blocks. Nine on data preparation: a head of product, a head of engineering, six front-end developers and one designer. Twenty on data visualisation: a project manager, twelve front-end engineers, two data scientists, four QA engineers and one designer. A boundary runs between them, because the two pods had separate roadmaps and separate ceremonies and nothing crossed it. The same marked cell appears in both blocks, which is the designer, counted twice, and is the whole shape of the job.
The problem arrived in Jira, not in a workshop
The join canvas is where analysts connect their tables before anything can be visualised. By 2023 its problems were on file, written by engineers, in the language of technical limitation rather than user experience. That framing is the reason the redesign was approved: nobody had to be convinced there was a problem, only that it was mine to solve.
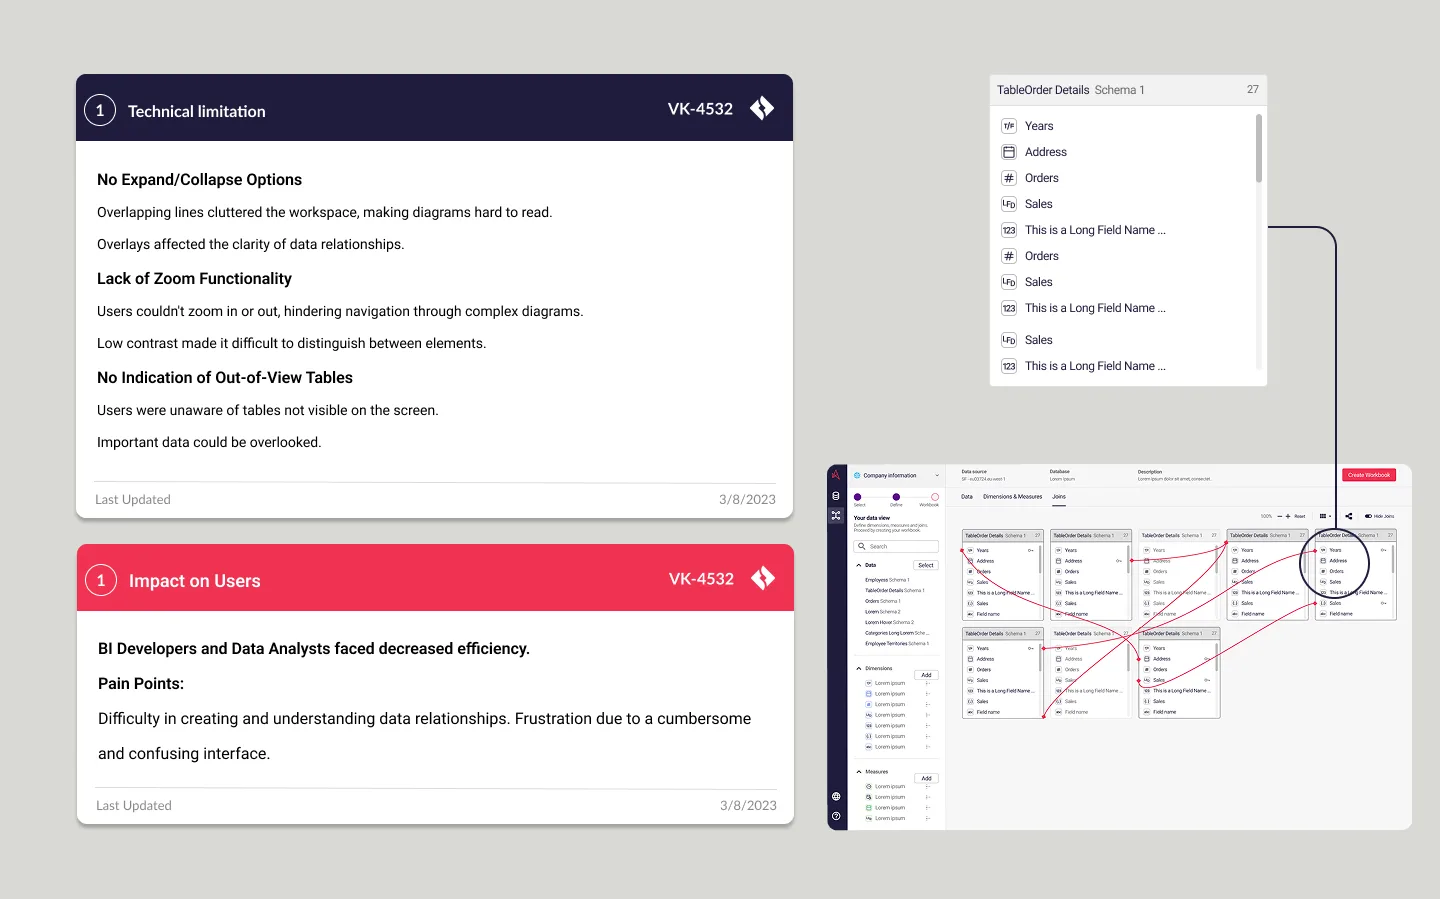
"Messy overlapping join lines" VK-4532 · THE PROBLEM IN THE WORDS IT WAS REPORTED IN
Three constraints in the engine, three opportunities on the surface
Most of what made the canvas unreadable was not a styling decision anyone had taken. It was the renderer: one kind of join, one direction of connection, and a layout engine that gave every line the same lane. The design work was to understand those constraints properly and then design around them without asking for the engine to be rewritten first.
Read this plate as text
The join canvas ticket read twice, once as engineering and once as design, either side of one boundary. On the left, four things the renderer could not do: one kind of join, one direction of connection, one lane for every line, and no way to zoom out or collapse. On the right, the three briefs those became: reduce human errors, improve diagram clarity, optimise navigation. Three of the four cross the boundary. The fourth, which would have meant replacing the renderer, is drawn severed and marked not taken, because it was not affordable and was never attempted.
Working with the grain of the technology is not a compromise, it is the only version of this job that ships. The canvas got readable because the lines learned to route around the tables and connect from any side, which the renderer could be taught, and not because the renderer was replaced, which it never would have been.
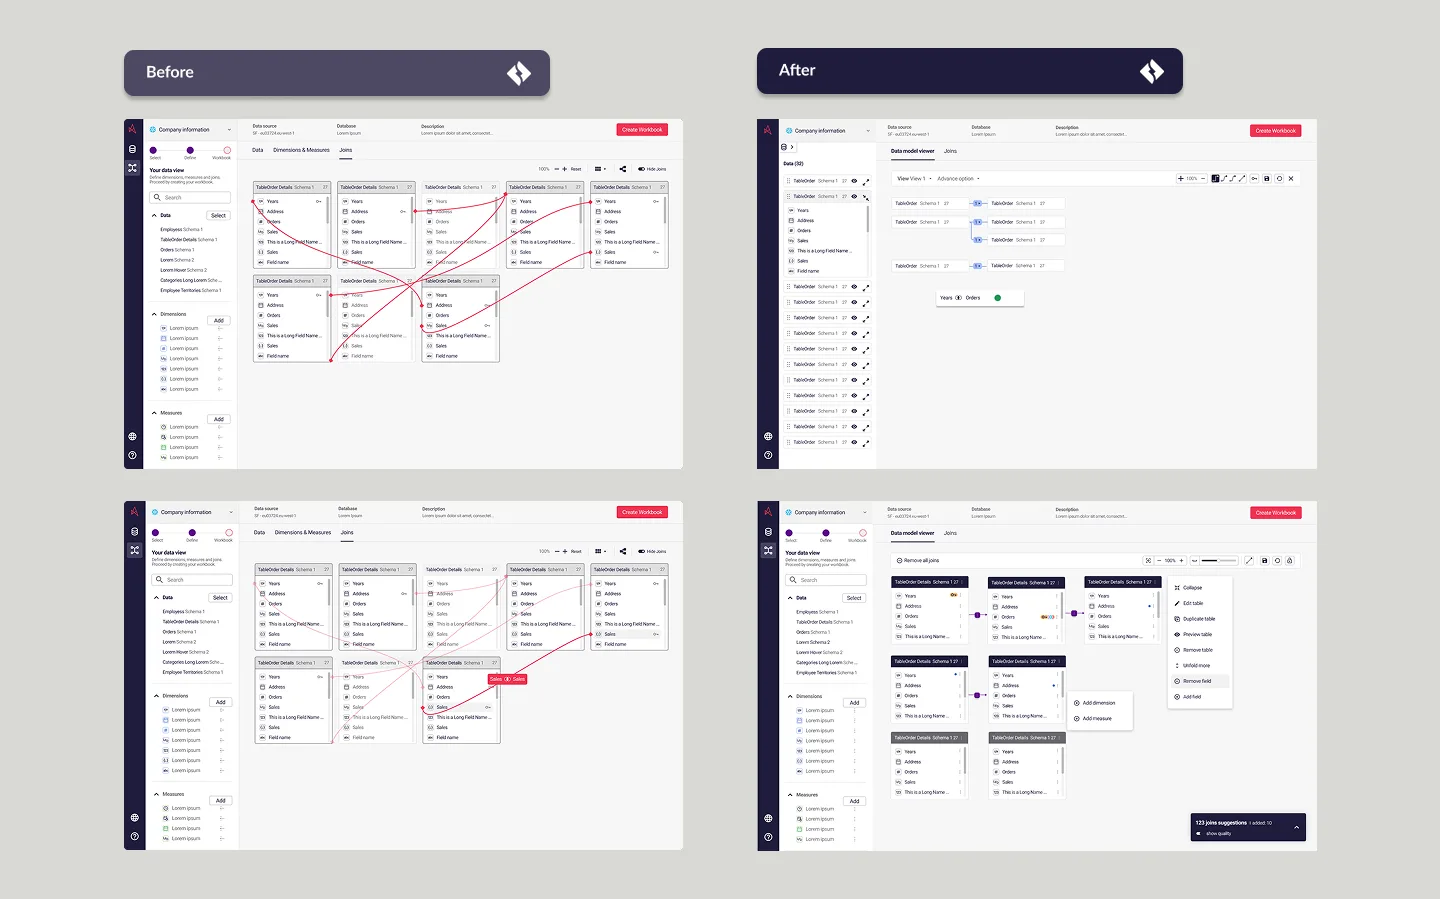
The same model, before and after
Nothing in this pair is a restyle. The tables are the same tables, the joins are the same joins, and the second picture is readable because the lines stopped crossing things they have no relationship with.
The clutter was measurable, so I measured it
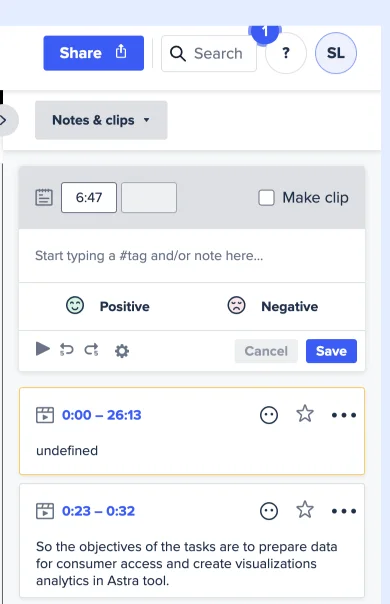
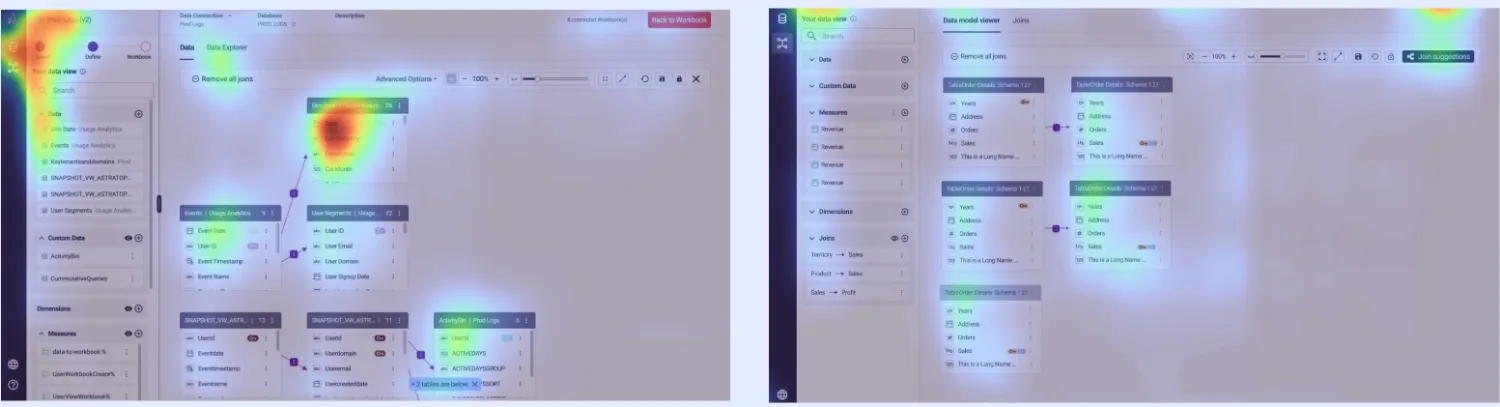
Moderated sessions were run through UserTesting with the real product, tagged live, and read back against attention heatmaps. The heatmaps are the part worth keeping: they show where people actually looked while trying to read a model, which is a different question from what they said about it afterwards.
Four of five rated the task easy. One did not.
This is the whole evidence base for the redesign, at the size it actually was. Five participants, one task, one difficulty question. Four put it at four out of five toward "very easy". One put it at three.
Read this plate as text
The difficulty question from the usability test, drawn at the size of its own sample. On a scale from one, very difficult, to five, very easy, one participant answered three and four participants answered four. Nobody answered one, two or five. Five people in total, which is the entire evidence base for the redesign and is drawn rather than described so that the sample size cannot be read past.
Read this plate as text
One question asked in plain English, and four ways of reading the same answer. The generated SQL, visible and editable. The scope, as controls rather than syntax, deciding which tables the answer may come from. The result explained in a sentence. And the chart itself, built from real measures and dimensions rather than drawn. Four readouts of one source, so that nothing the assistant knows is available only to the assistant.
The deck this came from also carried a set of large percentage improvements: collaboration, adoption, time to insight, error rates. They are not reproduced here, and that is a deliberate omission rather than modesty. I cannot now say how any of them was measured or over what period, and a number whose derivation nobody wrote down is not evidence, it is decoration. What survives is the thing with a visible sample size and a chart underneath it.
Teams were independently replicating dashboards to meet specific needs. This led to redundant data views and increased costs. THE RESULTS SLIDE · THE BUSINESS CASE IN ONE LINE
An assistant that shows its working
The hardest part of an analytics product is not running the query, it is knowing what to ask. Insights takes a question in plain language and returns a visualisation built from real measures and dimensions. The design decision that mattered was what it does next: it shows you the query it wrote.
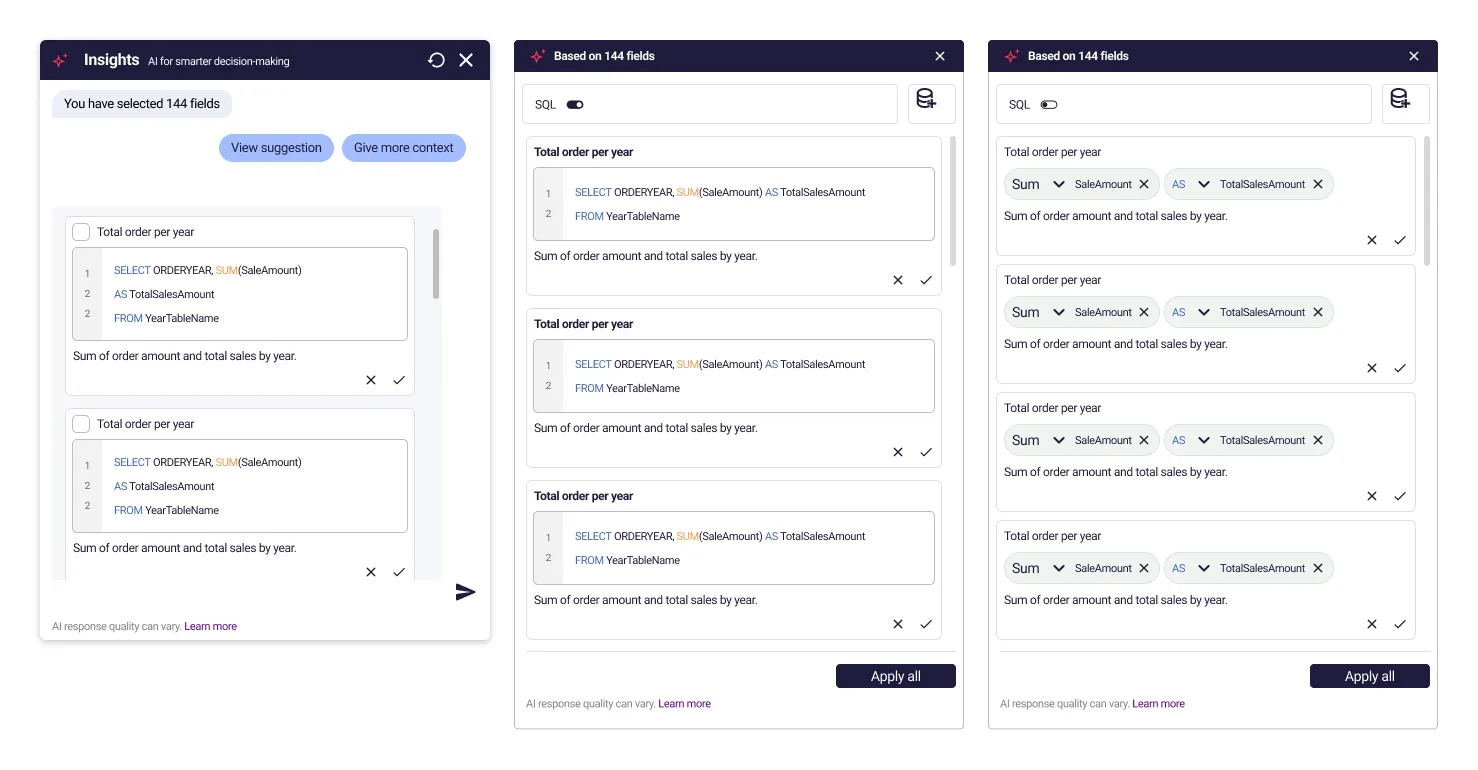
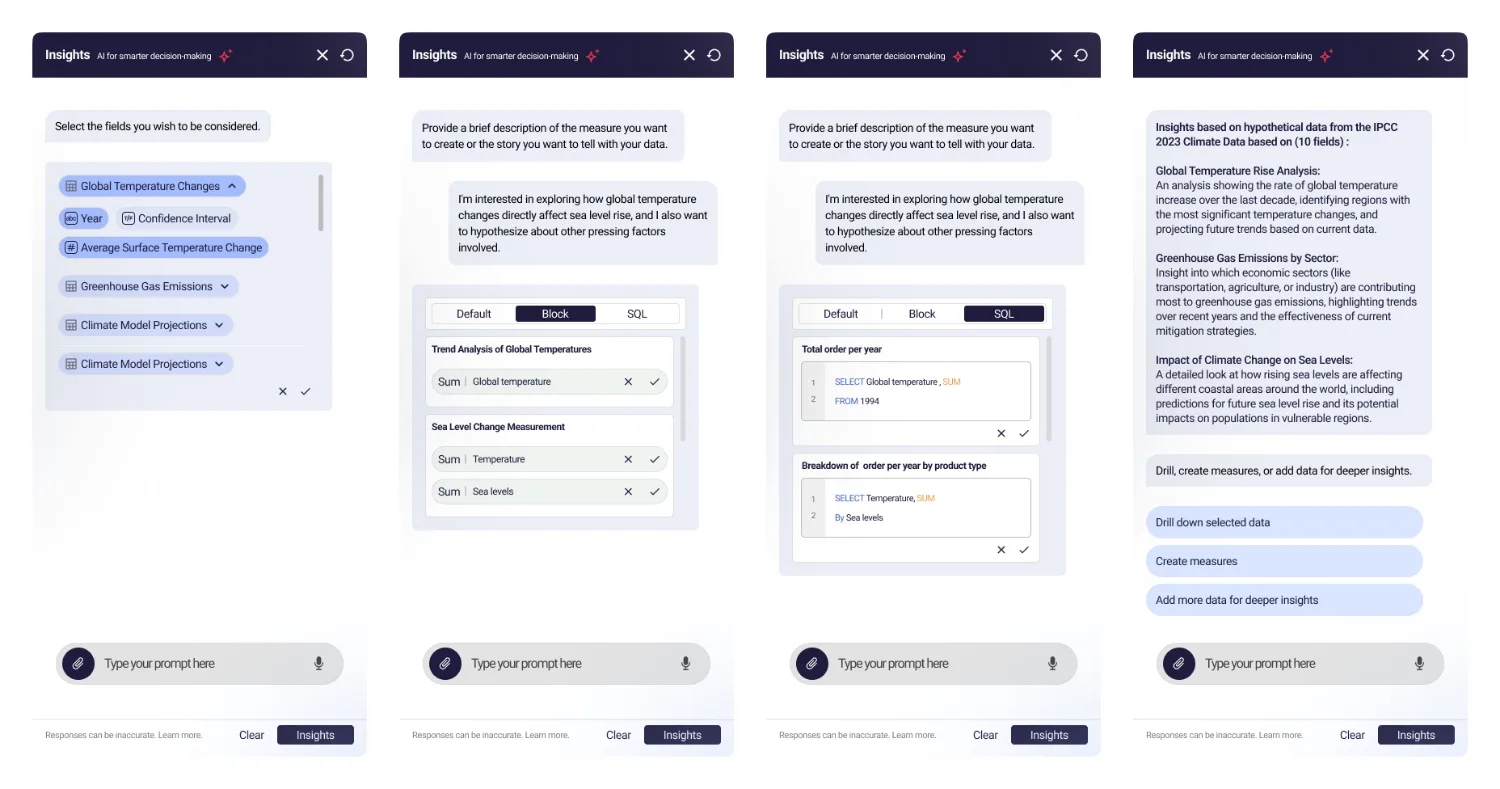
Three depths on one answer is not three features. It is one decision taken once: the assistant is never allowed to be the only thing that knows why it said something. In a tool whose output ends up in a board pack, an answer you cannot audit is a liability wearing the costume of a convenience.
New components only when necessary
Across three years and two pods I owned the component libraries for both products. The rule I held to was unpopular in roughly every sprint it applied to: a new component has to prove that no existing one can be stretched to fit, and most of the time one can.
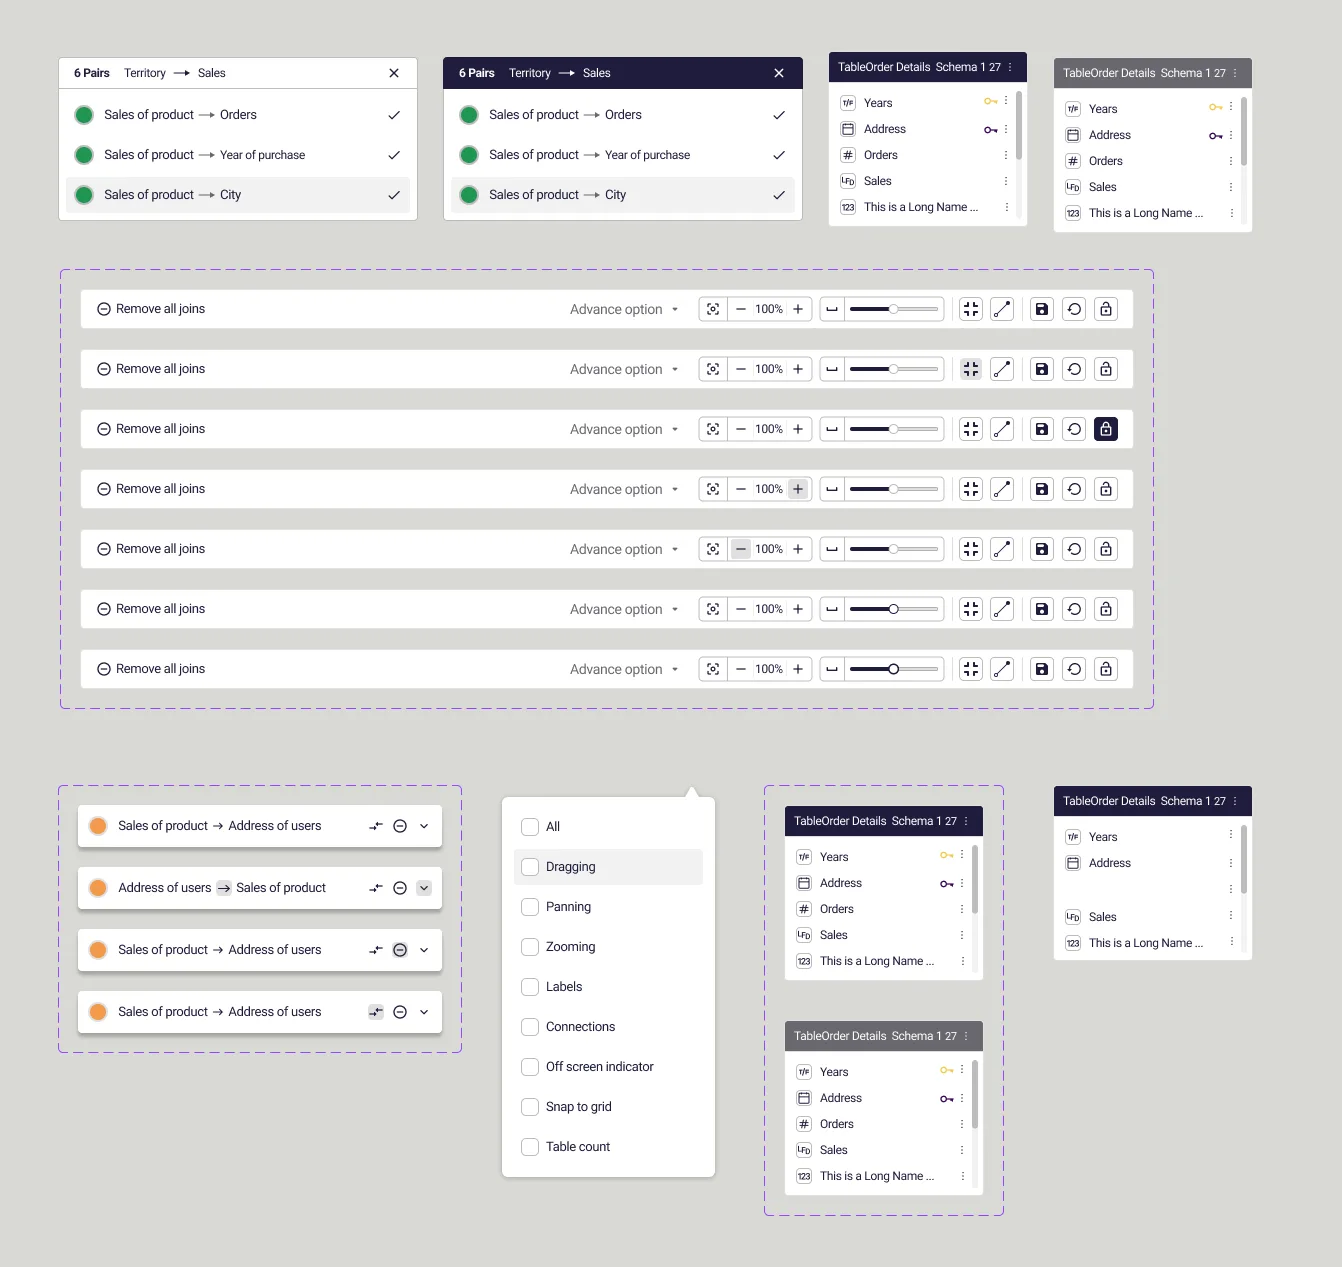
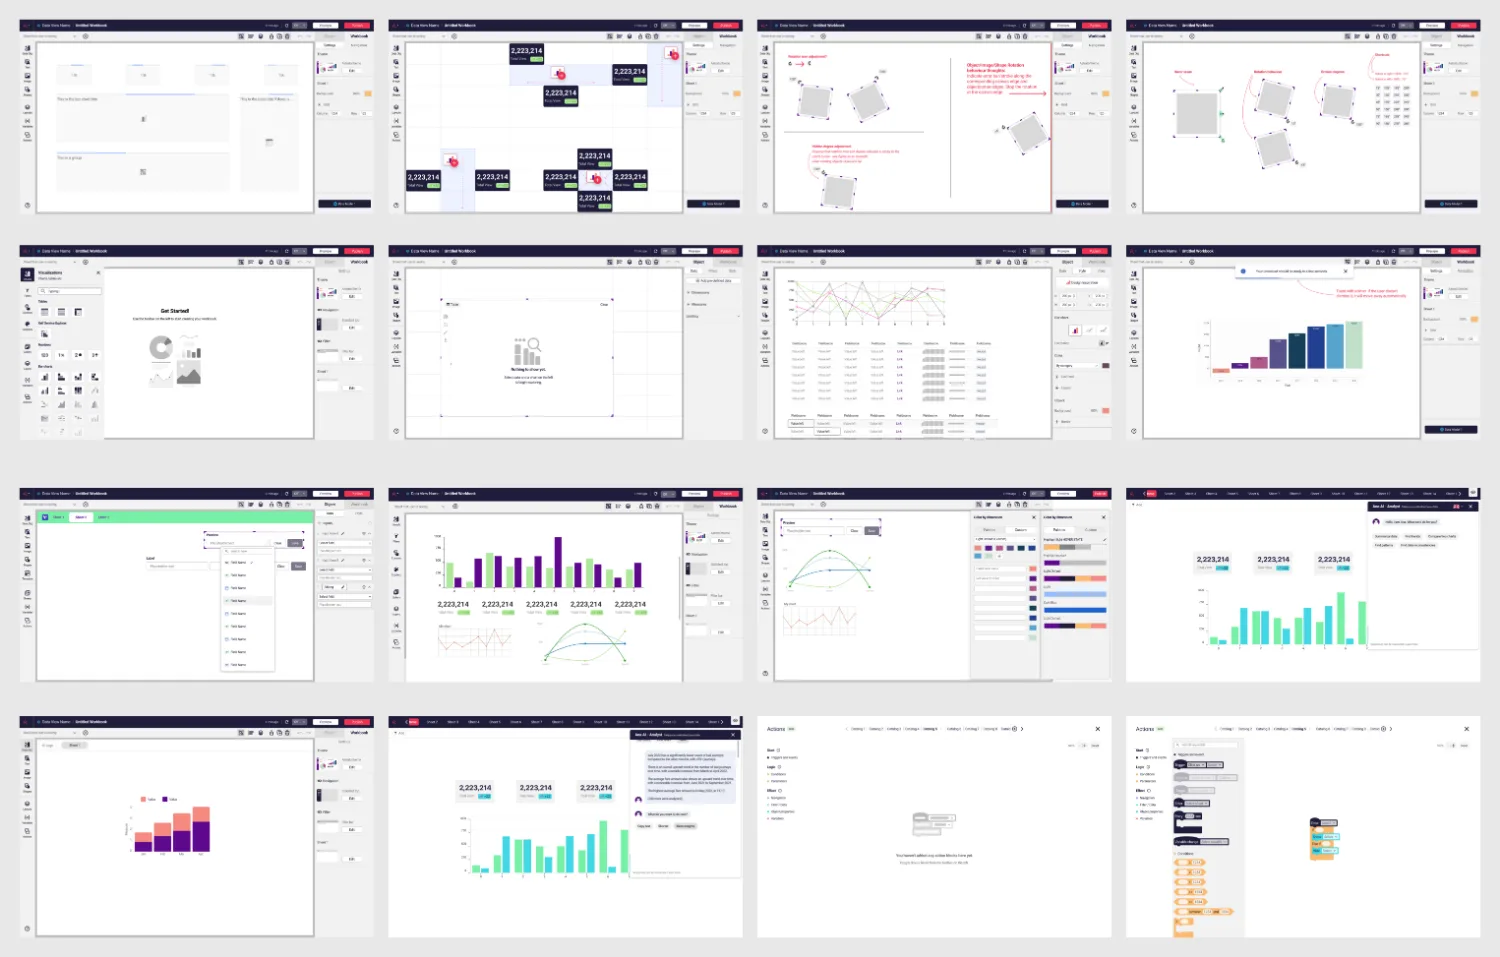
Restraint is what keeps a system a system. It is also what made the grid of surfaces above possible: those surfaces were designed years apart by one person under one set of rules, and they sit next to each other without any of them looking like it came from a different product. That is the forty features behaving like one thing, which is the claim this whole deck exists to support.
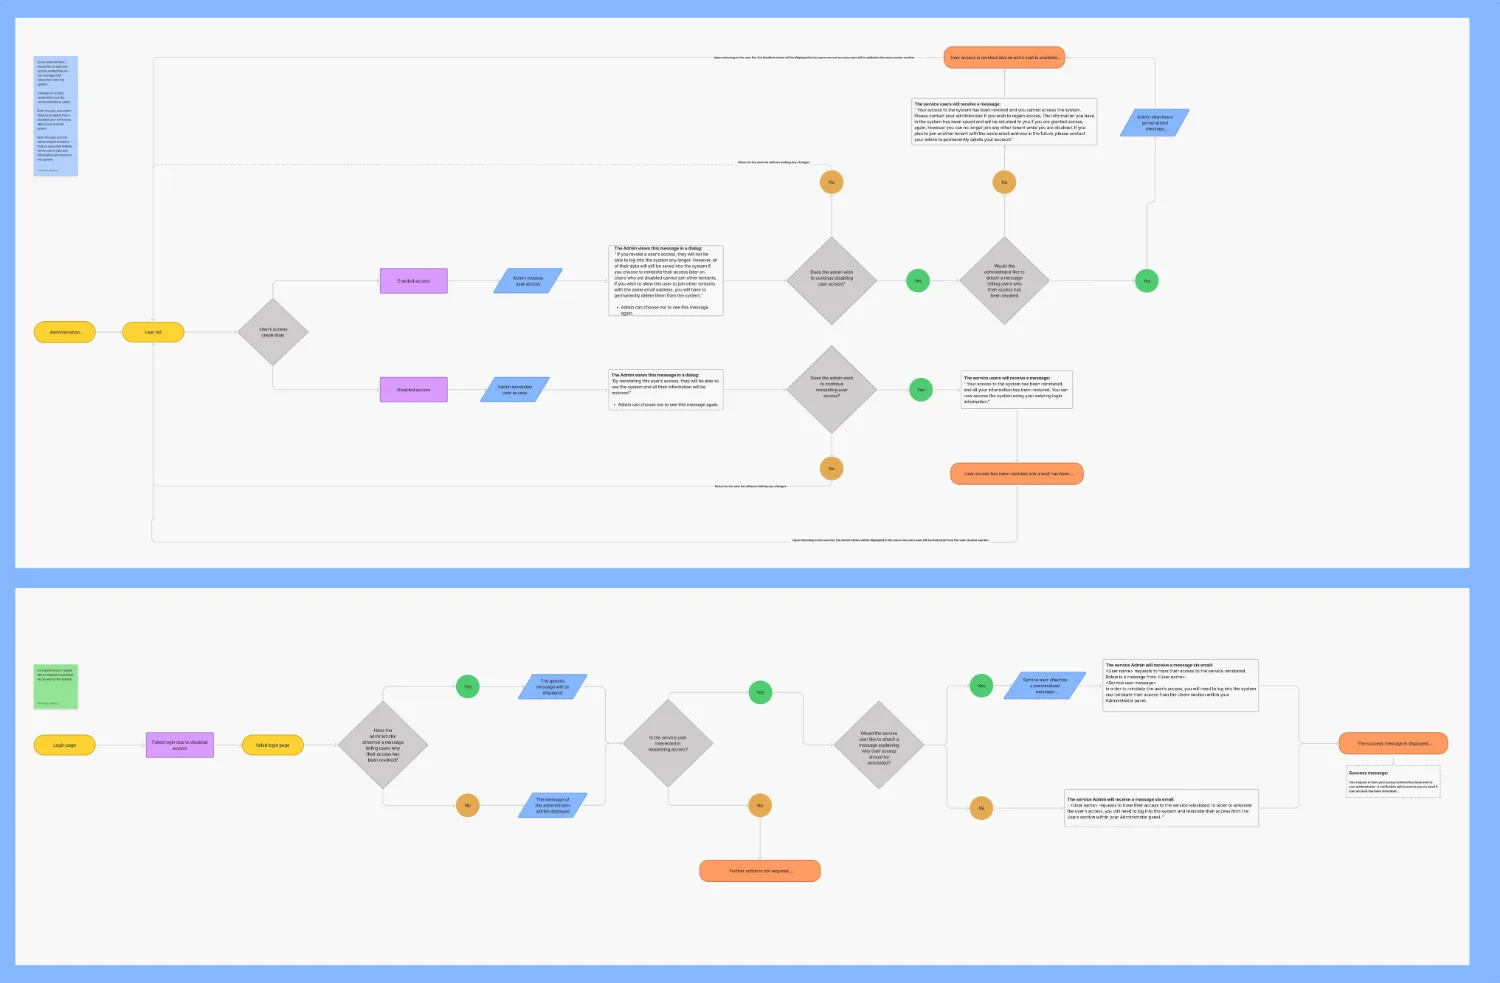
Four calls over three years, and what each one cost
The deck in its original form showed outcomes. These are the decisions underneath them, with the price of each written next to it, because a decision with no stated cost is one nobody had to take.
The honest diagnosis was that the layout engine was wrong. The affordable fix was to teach the lines to route around tables and leave from any side, inside the engine as it stood.
What it cost The underlying constraint is still there. A model past a certain size still gets hard to read, and I shipped an improvement rather than a solution, which is the trade every designer inside a real codebase actually makes and very few case studies admit to.
The simpler product is a chat box that returns a chart. Showing the SQL means showing the assistant being wrong, in public, in front of the analyst whose job it is to notice.
Why An analytics answer nobody can audit is worse than no answer, because it travels further. The cost was a more complicated interface and a more defensible one.
Every sprint produced a request for a component that already existed in a slightly different shape. The default answer was no, and the burden of proof sat with the request.
What it cost Being the person who says no to a team under delivery pressure, repeatedly, for three years. It is the least popular and most load-bearing thing on this page.
There was no handoff ceremony. Specs were written alongside the people implementing them, which is why the shipped product matches the design closely enough that the comparison is boring.
Why It costs the designer's time continuously rather than in a block, and it removes the moment where you get to blame the build. Both of those turn out to be the point.
The deliverable nobody writes down
What I would tell another designer taking a role like this: the deliverable nobody writes on a job description is continuity. Two pods with separate roadmaps will produce two products unless one person is carrying the context across the gap every week, and that person has no authority to do it with, only the ability to notice early and to have already talked to both sides.
The join canvas is the part of this I am still proudest of, and it is the least fashionable thing here: no new technology, no visual flourish, a renderer left intact, and a screen that stopped lying about which tables were related to each other.
The case file carries the argument and the running workbook builder. Read case file 002, or use the rebuilt product.