Case file 005 · JBS · on Astrato · reconstructed
JBS, and the two per cent that is the whole business
Shad Abbaslou · Product Design Lead · Hands-on across AI, Agents and Workflows
16 min read · 9 min skimmed · 40 slides
A reconstruction. The engagement was real and delivered on Astrato; the company figures are public, the data in the product is fictional, and no outcome is claimed.

Case file 005 · JBS · on Astrato · reconstructed
A reporting layer for a company that turns over BRL 417bn and keeps about 2.3% of it, where the margin is decided in three places that could not see each other.
Outcome · up front
Two per cent does not forgive a rounded chart
As on the Novo Nordisk file, every figure in that band is public and none of them is a result of this work. There is no adoption number and no efficiency claim on this page, because I cannot show you the measurement.
How this is told
Two diamonds: the problem, then the answer
Each diamond opens wide and closes on one thing: the first on the problem worth solving, the second on the answer. It is the order this deck is told in, and every slide carries its phase at the top left; the case file keeps the order of the work.
- Four hundred billion through the door…
- FIG. 004 · THE SLIVER
- Everything on this page follows from…
- and 5 more
- So the central object on the board is…
- I was asked for a confidence interval…
- Three systems on three clocks, drawn…
- and 2 more
The brief, in three lines
- Whata spread board for JBS, built on Astrato
- Forthe plant controller and the commercial team
- Problemthe margin was decided in three systems on three clocks, and nobody saw it whole until a lot closed
THE PRODUCT, NOT A PICTURE
A walkthrough, 18 seconds, recorded from the rebuild. The spread board, step by step: an approval pulled and restored, every lot, how the spread assembles, and yield shift by shift. Each step is captioned as it happens, and the transcript has the same words.
Phase 1 of 4 · widenDiscover
What was actually wrong, and for whom: the evidence before any answer.
The business
Four hundred billion through the door. Nine billion stays.
JBS reported net revenue of BRL 416.9bn for 2024, about USD 77.2bn, and net profit of BRL 9.6bn. That is a net margin of roughly 2.3%. Around 270,000 people, selling to more than 300,000 customers in about 190 countries.

The business
The business
Everything on this page follows from that. A reporting layer for a 41% margin business can afford to be approximate and directional. A reporting layer for a 2.3% margin business cannot, because the entire profit sits inside the error bars of a careless chart.
Where margin is decided
Three decisions, three systems,
The spread on a lot is set by three separate decisions taken by three separate groups of people, recorded in three separate systems, on three separate time bases. By the time they can be reconciled, the lot is closed and the money is already made or lost.
"We know the margin. We know it on Thursday." THE SENTENCE THE PROJECT WAS BUILT AGAINST
Where margin is decided
Research
The plant manager already had a better number
As with the other engagement on this platform, the people closest to the operation had already solved their own version of the problem, and the reporting layer's job was to stop them each solving it differently.

Research
I will say about research here only what a reconstruction can honestly support. The recurring finding in this kind of work, and the one that shaped the board, is that operational people do not distrust dashboards because the dashboards are ugly. They distrust them because they have been burned by a number that moved without explanation, and they have each built a private spreadsheet whose provenance they can personally vouch for.
Phase 2 of 4 · narrowDefine
The problem narrowed to the one worth solving, and the rules any answer had to keep.
Where margin is decided
So the central object on the board is not a margin figure. It is a spread that knows how finished it is. Every lot carries a settled proportion: how much of its value has actually been sold against how much is still inventory being valued at an assumption. A lot that is 40% settled and a lot that is 95% settled are not the same claim, and showing them as two bars of the same colour is the error the old reporting made.
Where margin is decided
I was asked for a confidence interval and argued for a completion percentage instead. An interval invites you to read the midpoint. A settled proportion makes you ask the right question, which is not how wrong this might be but how much of it has actually happened yet.
The blueprint
Three systems on three clocks, drawn as one line
The blueprint
One carcass, many markets
There is no such thing as the price of beef
Phase 3 of 4 · widenDevelop
The answer drawn, tried and argued over, including the parts that were thrown away.
One carcass, many markets
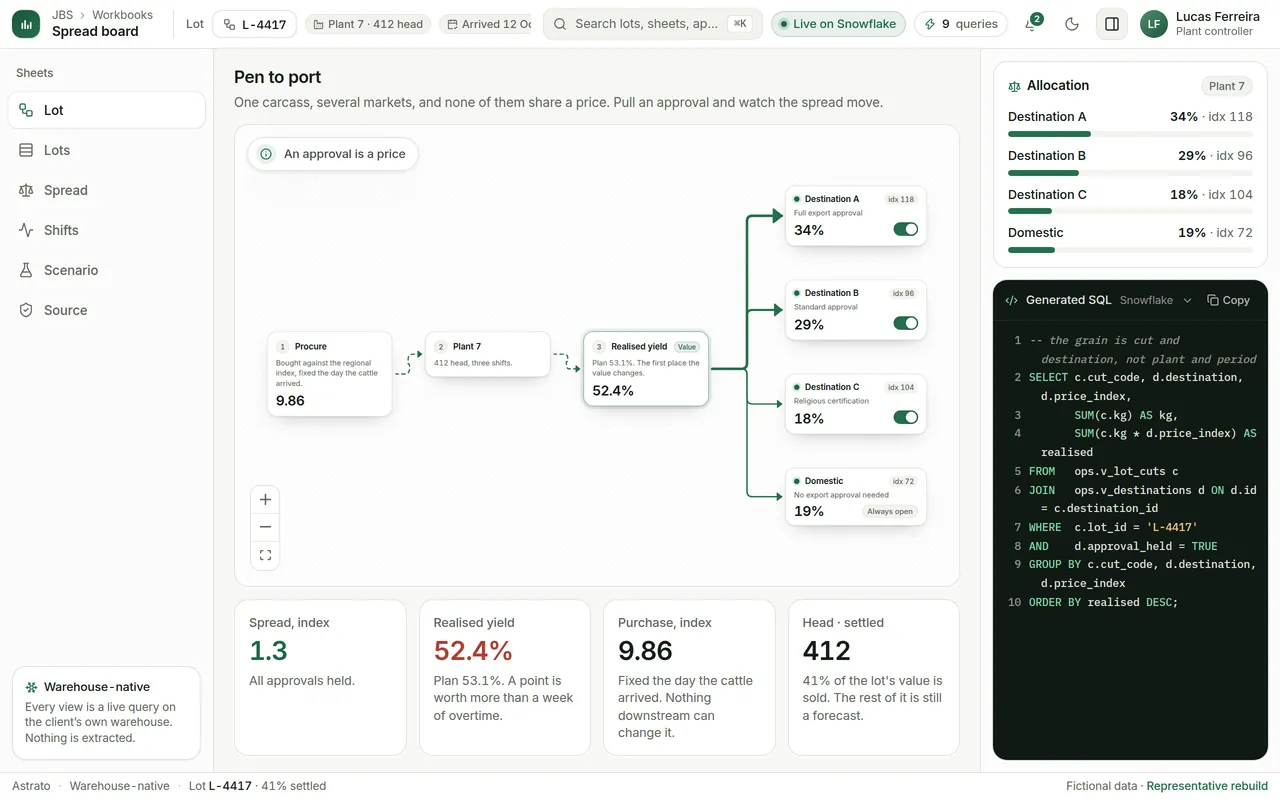
That is the modelling decision the whole board rests on. The old reporting keyed on plant and period, because that is how the plants are managed. The board keys on cut and destination, because that is where the money is decided, and rolls up to plant and period from there. It sounds like a technicality. It is the difference between a screen that tells you a plant had a bad week and a screen that tells you which market closed.

Where margin is decided
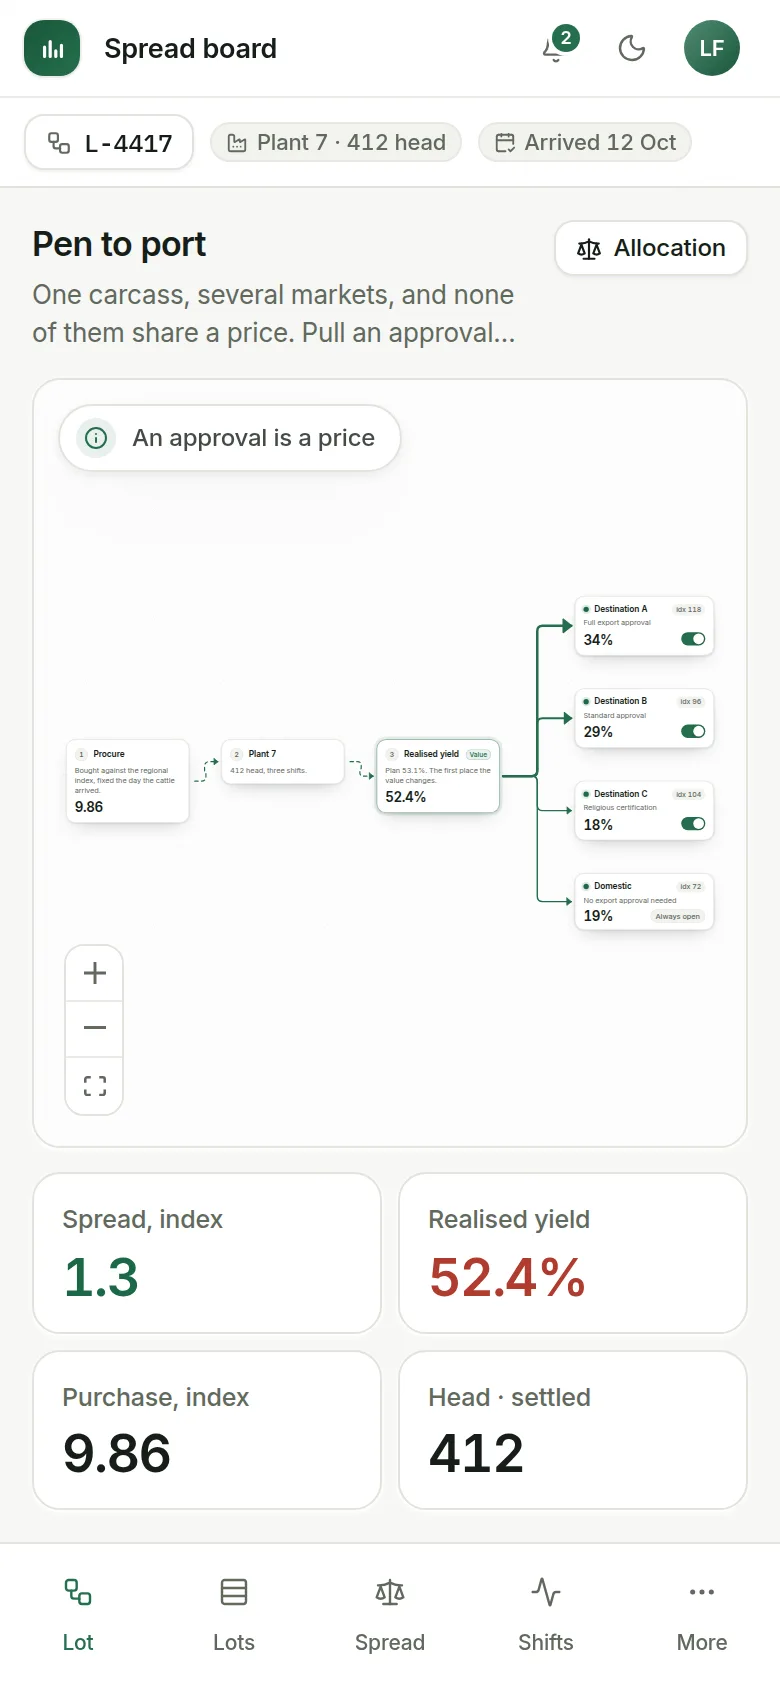
Seven seconds, recorded from the rebuild. Destination A’s export approval is pulled. Its cuts re-route to the domestic market at a lower index, the spread on the lot falls from 1.3 to −6.9, and the allocation and the SQL restate; then the approval comes back and so does the spread.
Each chart, and what it has to say
Each chart, and what it has to say
A chart is chosen by the relationship it has to show, in the categories of the Financial Times’ Visual Vocabulary. In the rebuild every mark reads at 3:1 against its card or carries its value in print, so no number depends on telling two colours apart.
| Chart | What it has to show | The form, and why |
|---|---|---|
| How the spread assembles | Magnitude, and the gap between two of them: the price paid, what the lot realised, and the spread that is their difference | Three bars on one scale, each labelled, the spread coloured and signed by direction |
| Settled, not estimated | Part-to-whole: one share of the lot | A single ring with the figure printed beside it; the ring is drawn, the number is read |
| Yield by shift | Deviation from the plan | Columns against a dashed plan line, each with its value |
| Realised yield at the plant | Change over time, against the plan | One line per shift with the plan dashed across it, so a drift shows as a gap that opens |
| Two spreads, one lot | Magnitude: as it stands against your inputs | Two horizontal bars on one scale, each labelled |
Proving the source
The supplier you buy from is not the only supplier
Sourcing compliance in Brazilian beef is a live and public issue for this company, and it is genuinely a data problem rather than a policy one. The difficulty is not screening the farm you bought from. It is the farm that sold to that farm.

Proving the source
Where margin is decided
A central board does not win that argument by being prettier. It wins it by being auditable: every figure can be opened to the query that produced it, every definition is stated where it is used rather than in a glossary nobody opens, and every number that changed since last week can say what changed it.

The flow
From the pen to the port, and back into the price
The blueprint
The gate is the part that was in the wrong department. Export approvals were tracked as a compliance list by people who did not own the spread, so a market shutting mid-lot showed up as a bad week at a plant. On this line the gate sits between the plant and the markets, where it actually is, and pulling it moves the share on the board the moment it is pulled.
Phase 4 of 4 · narrowDeliver
What the rebuild is held to, what each decision moved, and what I would do differently. No outcome is claimed.
What was broken · what changed · 01 of 05
The realised spread on a lot could only be stated once every cut had been sold, which in practice meant a weekly number arriving after the decisions it should have informed.
The board shows a spread that is still forming, with a settled proportion attached: how much of the lot’s value is actually sold against how much is inventory held at an assumption.
A late complete number is worth less than an early honest partial, as long as the partial says how partial it is.
What was broken · what changed · 02 of 05
I was asked for confidence intervals on the unsettled portion.
A completion percentage instead of an interval.
An interval invites the reader to take the midpoint as the answer. A completion percentage makes them ask how much has happened, which is the question that actually has a knowable answer.
What was broken · what changed · 03 of 05
Reporting keyed on plant and period, because that is how plants are managed, so a bad week looked like a plant problem whatever had actually caused it.
The model keys on cut and destination and rolls up to plant and period from there.
Price is decided per cut per market. Keying anywhere coarser averages away the only dimension that explains the movement.
What was broken · what changed · 04 of 05
Export approvals were tracked as a compliance list in a different department from the one that owned the margin.
Approval status sits on the same screen as the spread, with the volume currently depending on each approval shown beside it.
An approval is a price. Keeping it on a compliance page means the commercial consequence of losing one is discovered rather than anticipated.
What was broken · what changed · 05 of 05
Sourcing compliance was presented as a tick, which could not distinguish between a chain that had been checked and one that could not be.
Coverage is shown as a proportion with the unscreened share drawn rather than omitted, separating direct from indirect suppliers.
Converting an open question into a green tick is the failure mode that matters most here, because it is the one that gets quoted externally.
Outcome
Two per cent does not forgive a rounded chart
| It worked if | Result | Status |
|---|---|---|
| No spread appears without how settled it is | 0 spreads shown without a settled proportion | Held in the rebuild |
| A live approval visibly moves the route | 4 destinations with a live approval; pulling one redirects the share | Held in the rebuild |
| Readers adopt it and decide sooner | Not measured, so not claimed | Not measured |
Outcome
What I would do differently
What I would tell another designer taking this on: find out what the margin is before you design anything. It is a single number and it silently sets the tolerance for every decision you are about to make. At forty per cent you are designing for comprehension. At two per cent you are designing for precision, and those are not the same brief wearing different clothes.
- Find who owns each input before drawing the screen. The export gate was tracked as a compliance list by people who did not own the spread, so a market shutting mid-lot showed up as a bad week.
- Agree targets with a way to measure them. This file sets targets, not results, because no adoption was recorded. The targets should have come with their measurement.
THE PRODUCT, NOT A PICTURE
The finished product, running
Case file 005 · JBS · on Astrato · reconstructed
Questions
Two per cent does not forgive a rounded chart
A reconstruction. The engagement was real and delivered on Astrato; the company figures are public, the data in the product is fictional, and no outcome is claimed.
The other decks001 · OI·DS002 · Astrato003 · Safe Space004 · Novo Nordisk